> For the complete documentation index, see [llms.txt](https://docs.kepler.gl/llms.txt). Markdown versions of documentation pages are available by appending `.md` to page URLs; this page is available as [Markdown](https://docs.kepler.gl/docs/user-guides/h-playback.md).
# Time Playback
Follow these steps to create a playback video of an event:
1. Add a filter based on a time-related field, like timestamp. For GeoJson, property field should contain a timestamp entry.
2. The playback window will appear on the bottom of the map. The bars are distribution graphs of all data points by time. Select the desired rolling time window:

3. Press play to start the video. Click on the speed value and select/input your desired value *1x*, *2x*, *4x* on the top right to change the playback speed.

4. Choose custom y axis. You can click **Select Y Axis** to change the default distribution graph to a timeseries of the selected column. An example use of this function is to show a distance vs. time graph of a given trip.
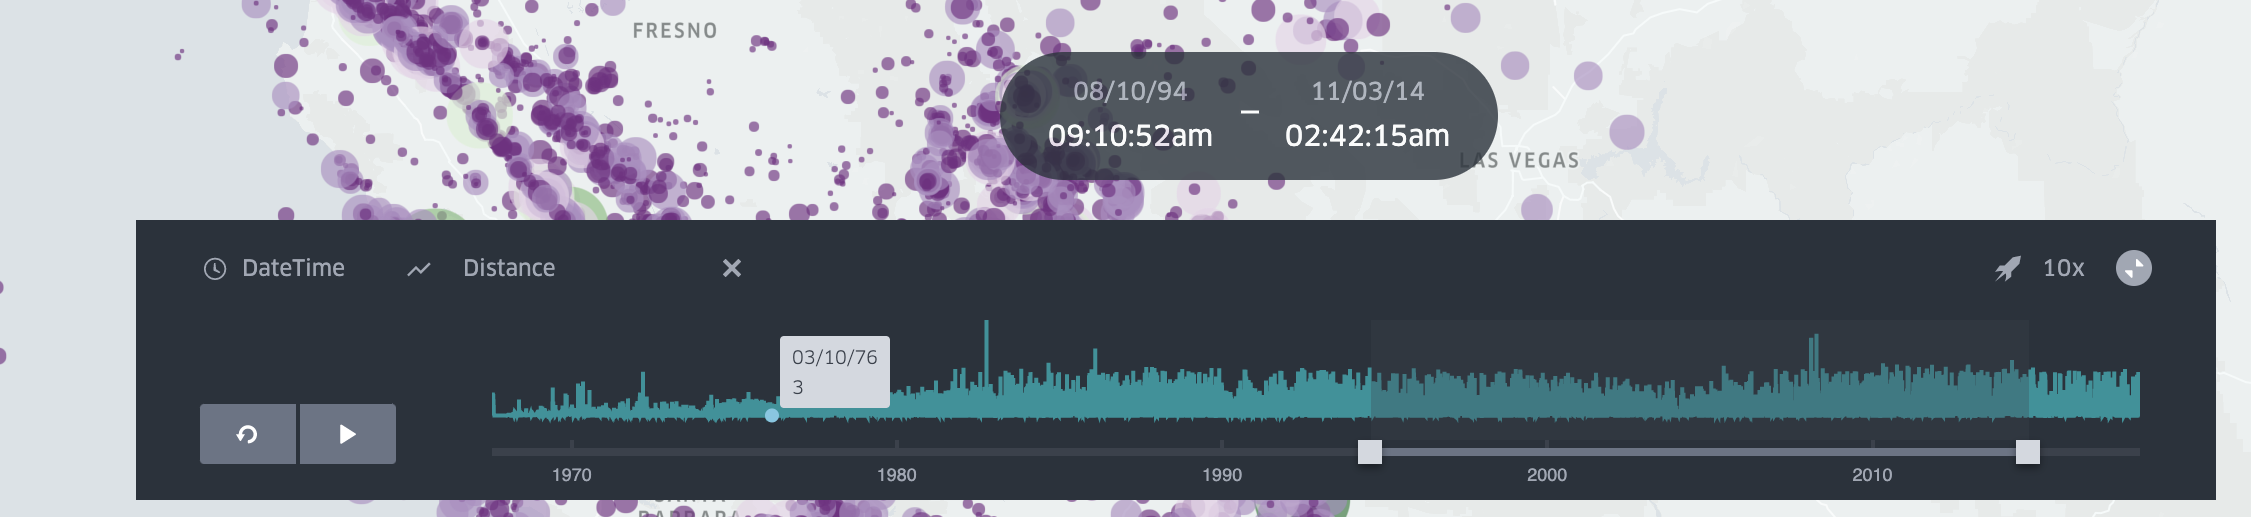
## Zoom & precision controls
The enlarged timeline now lets you stay focused on the portion that matters:
* Use the mouse wheel to resize the window under the cursor, and pinch (or hold Ctrl on Windows/Linux or ⌘ on macOS while scrolling) to zoom the full timeline.
* A lightweight "Showing" bar appears whenever the full range is narrowed—click **Reset** to return to the original domain.
* Hold Ctrl (Windows/Linux) or ⌘ (macOS) and press the arrow keys to pan left/right, with Shift for bigger steps.
[Back to table of contents](/docs/user-guides.md)