Layers
Single Feature Layers
Single feature layers render 1 feature
Point
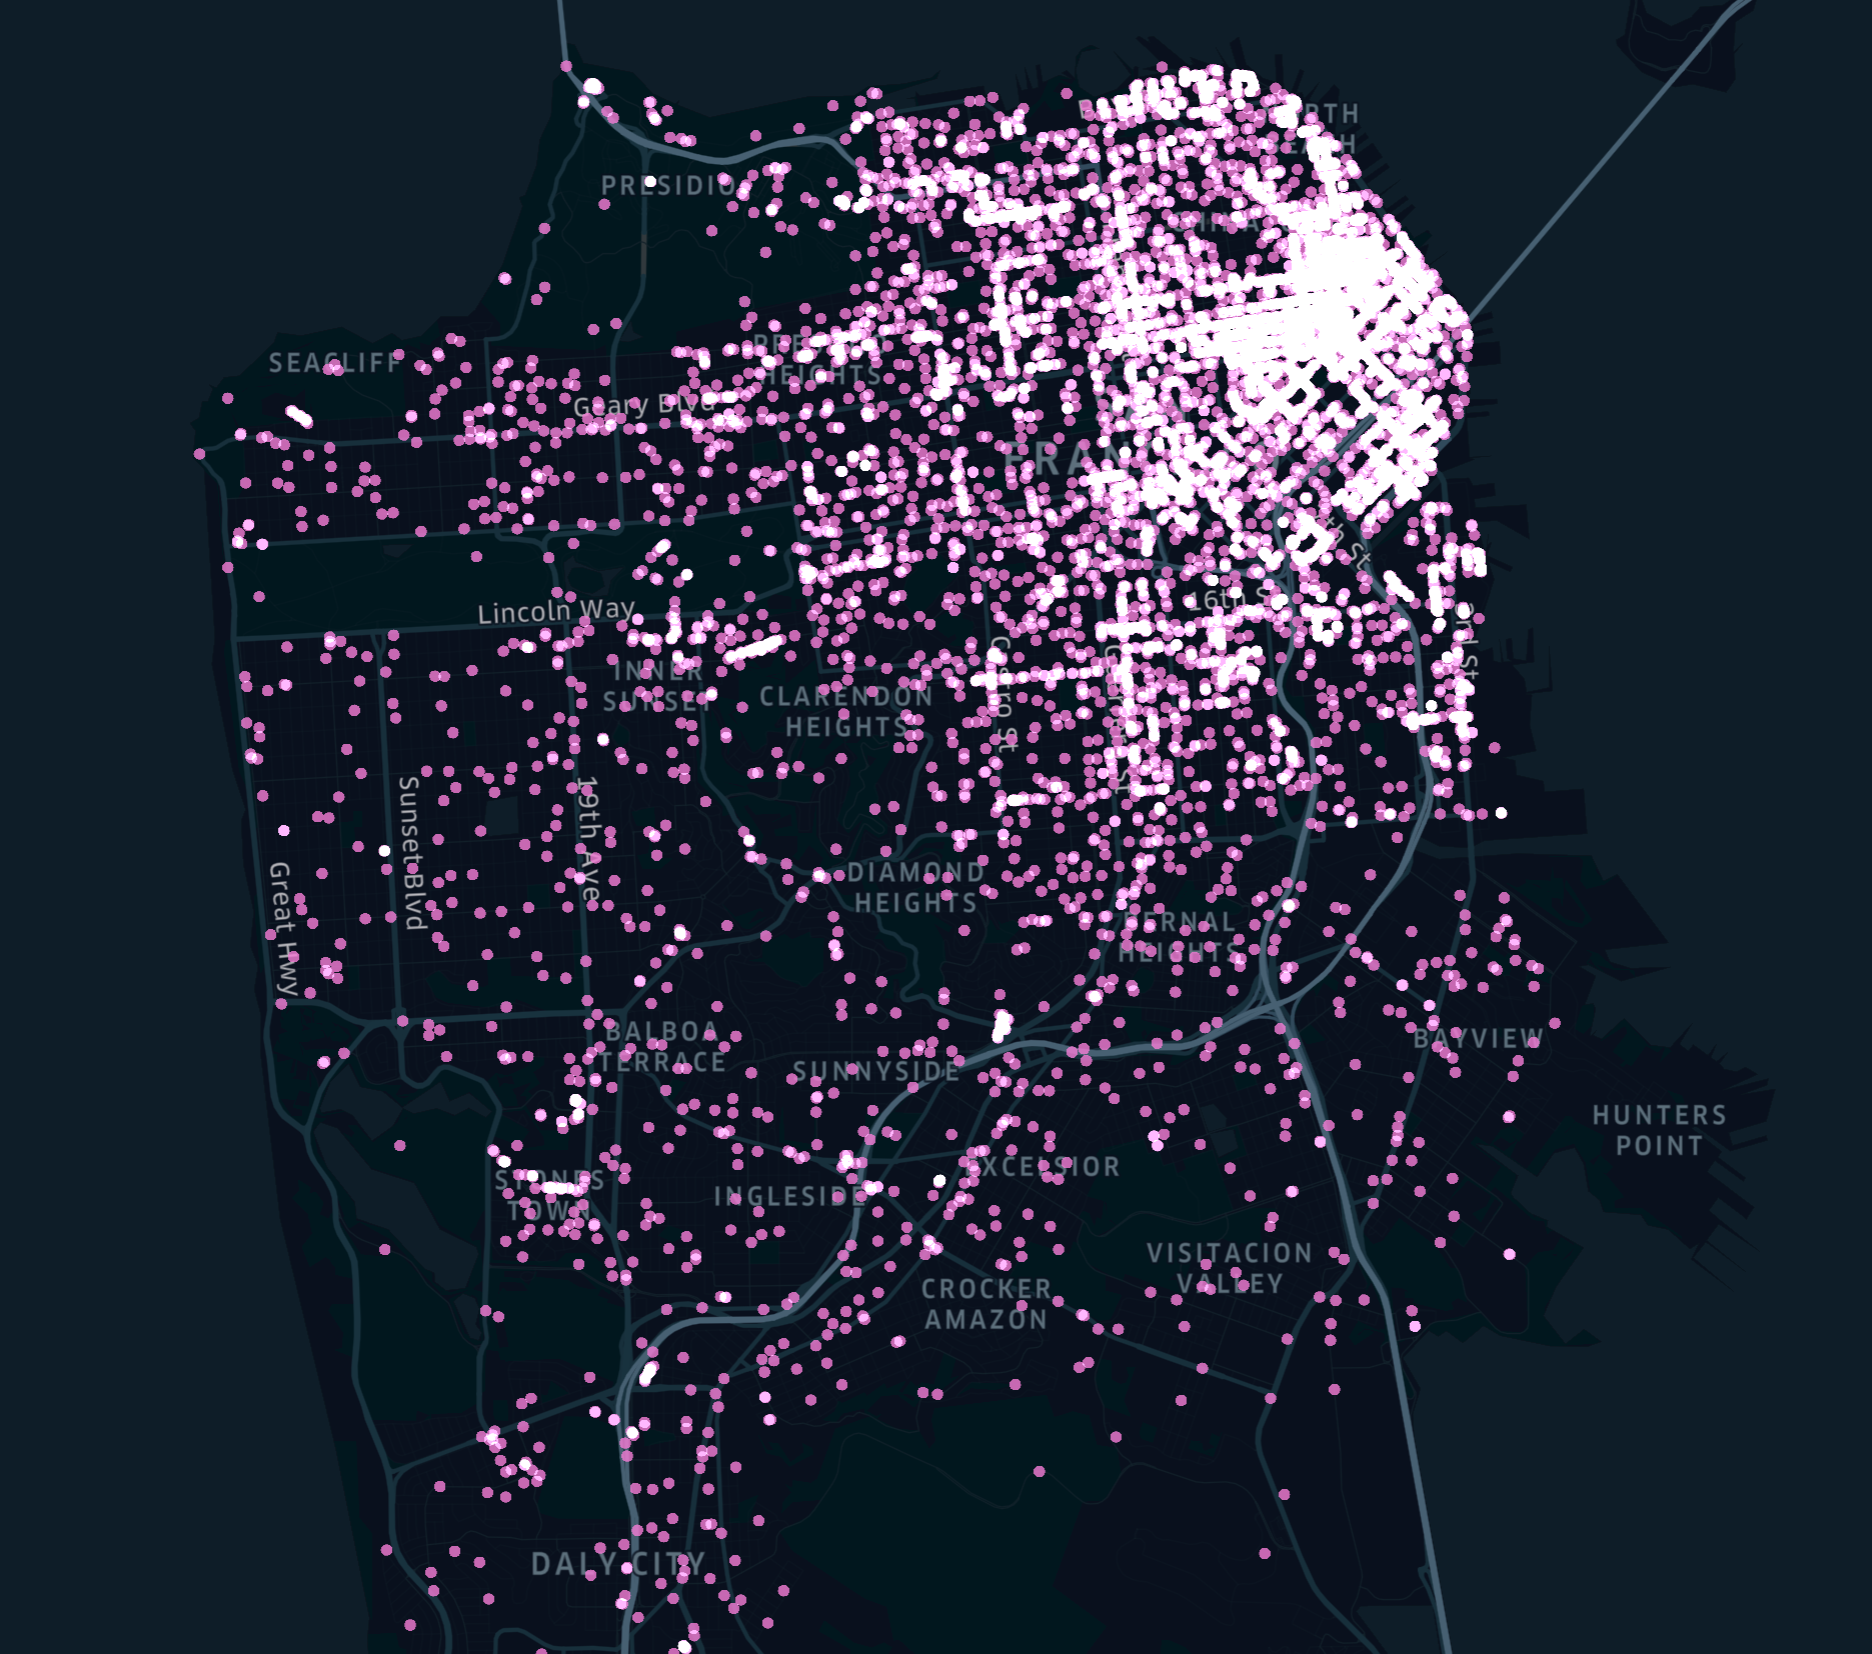
Point layers draw points for a given event or object based on its location - latitude and longitude.
Arc
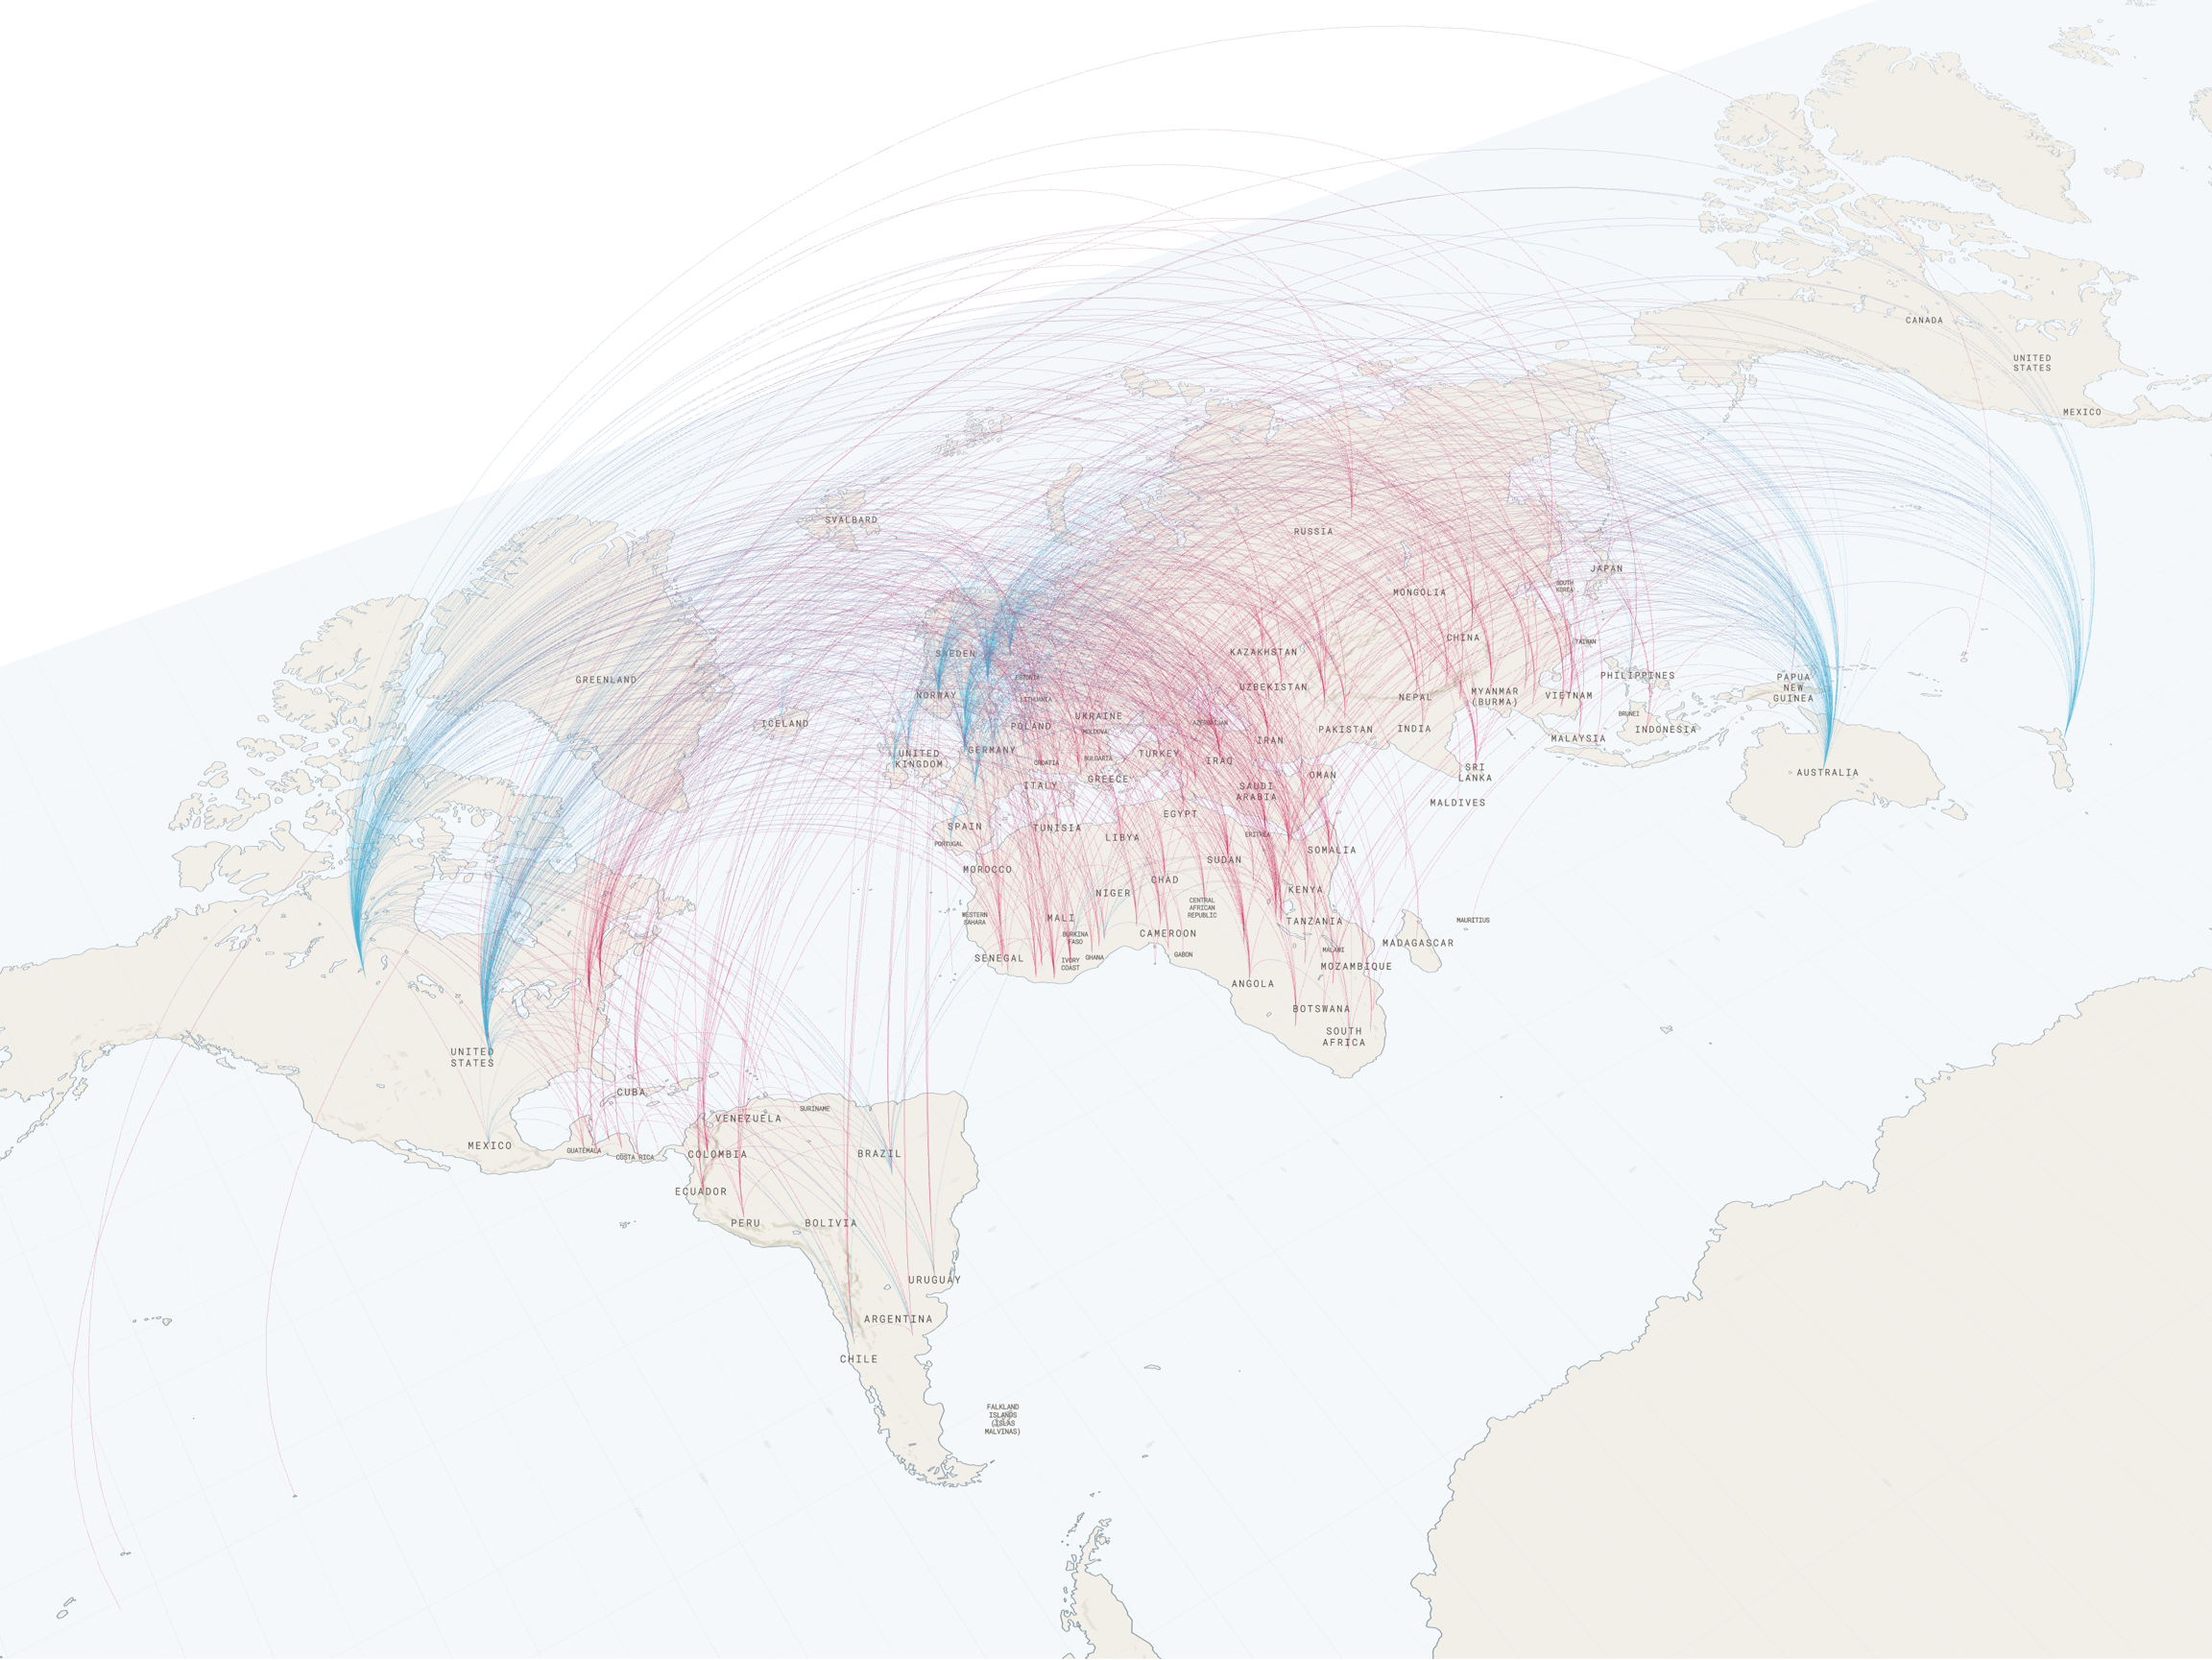
Arc layers draw an arc between two points. They’re useful for visualizing the distance between two points as well as comparing distances in 3D. Note that arc layers don’t show routes between points, but simply the distance between the two points. The tallest arc represents the greatest distance.
To draw arcs, your dataset must contain the latitude and longitude of two different points for each arc.
Layer Attributes: Color/ Color Based On, Opacity, Stroke Width/ Stroke Based On, High Precision Rendering
Line
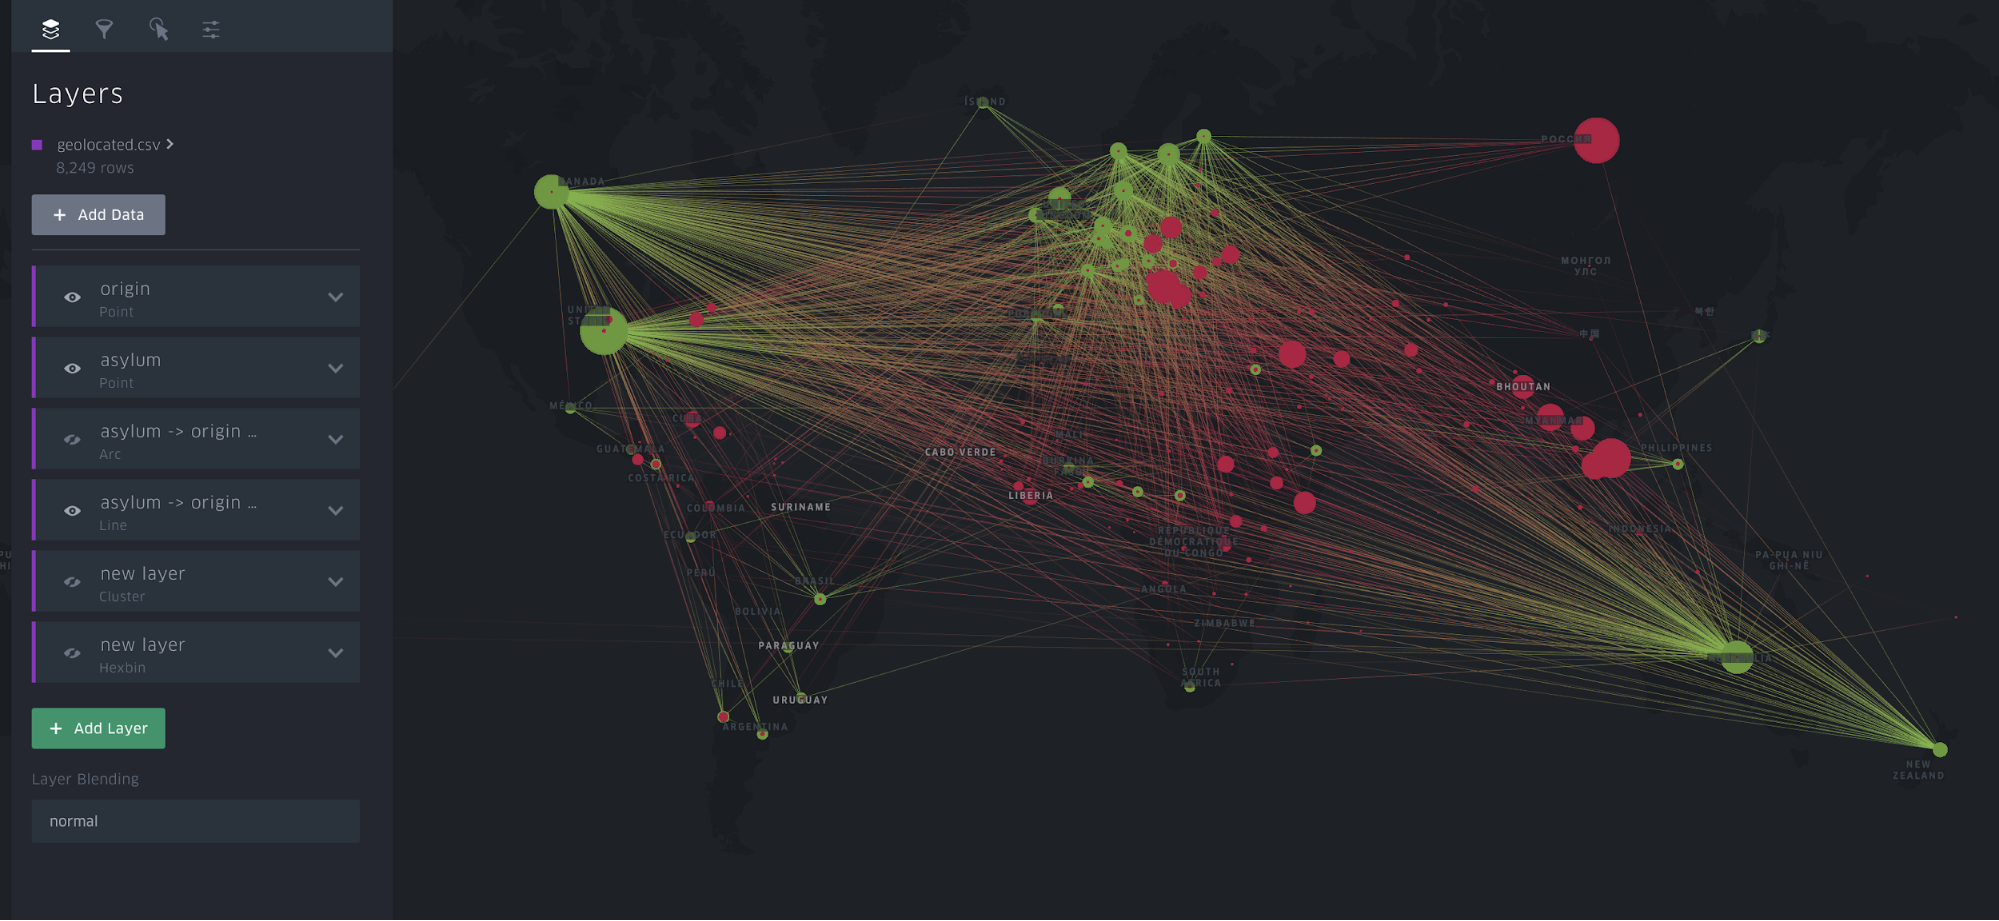
Line layers are the 2D version of arc layers. Both draw a line between two points to represent distance, but in a line layer, the drawing lies flat on the map.
Layer Attributes: Color, Stroke, High Precision Rendering
Hexbin
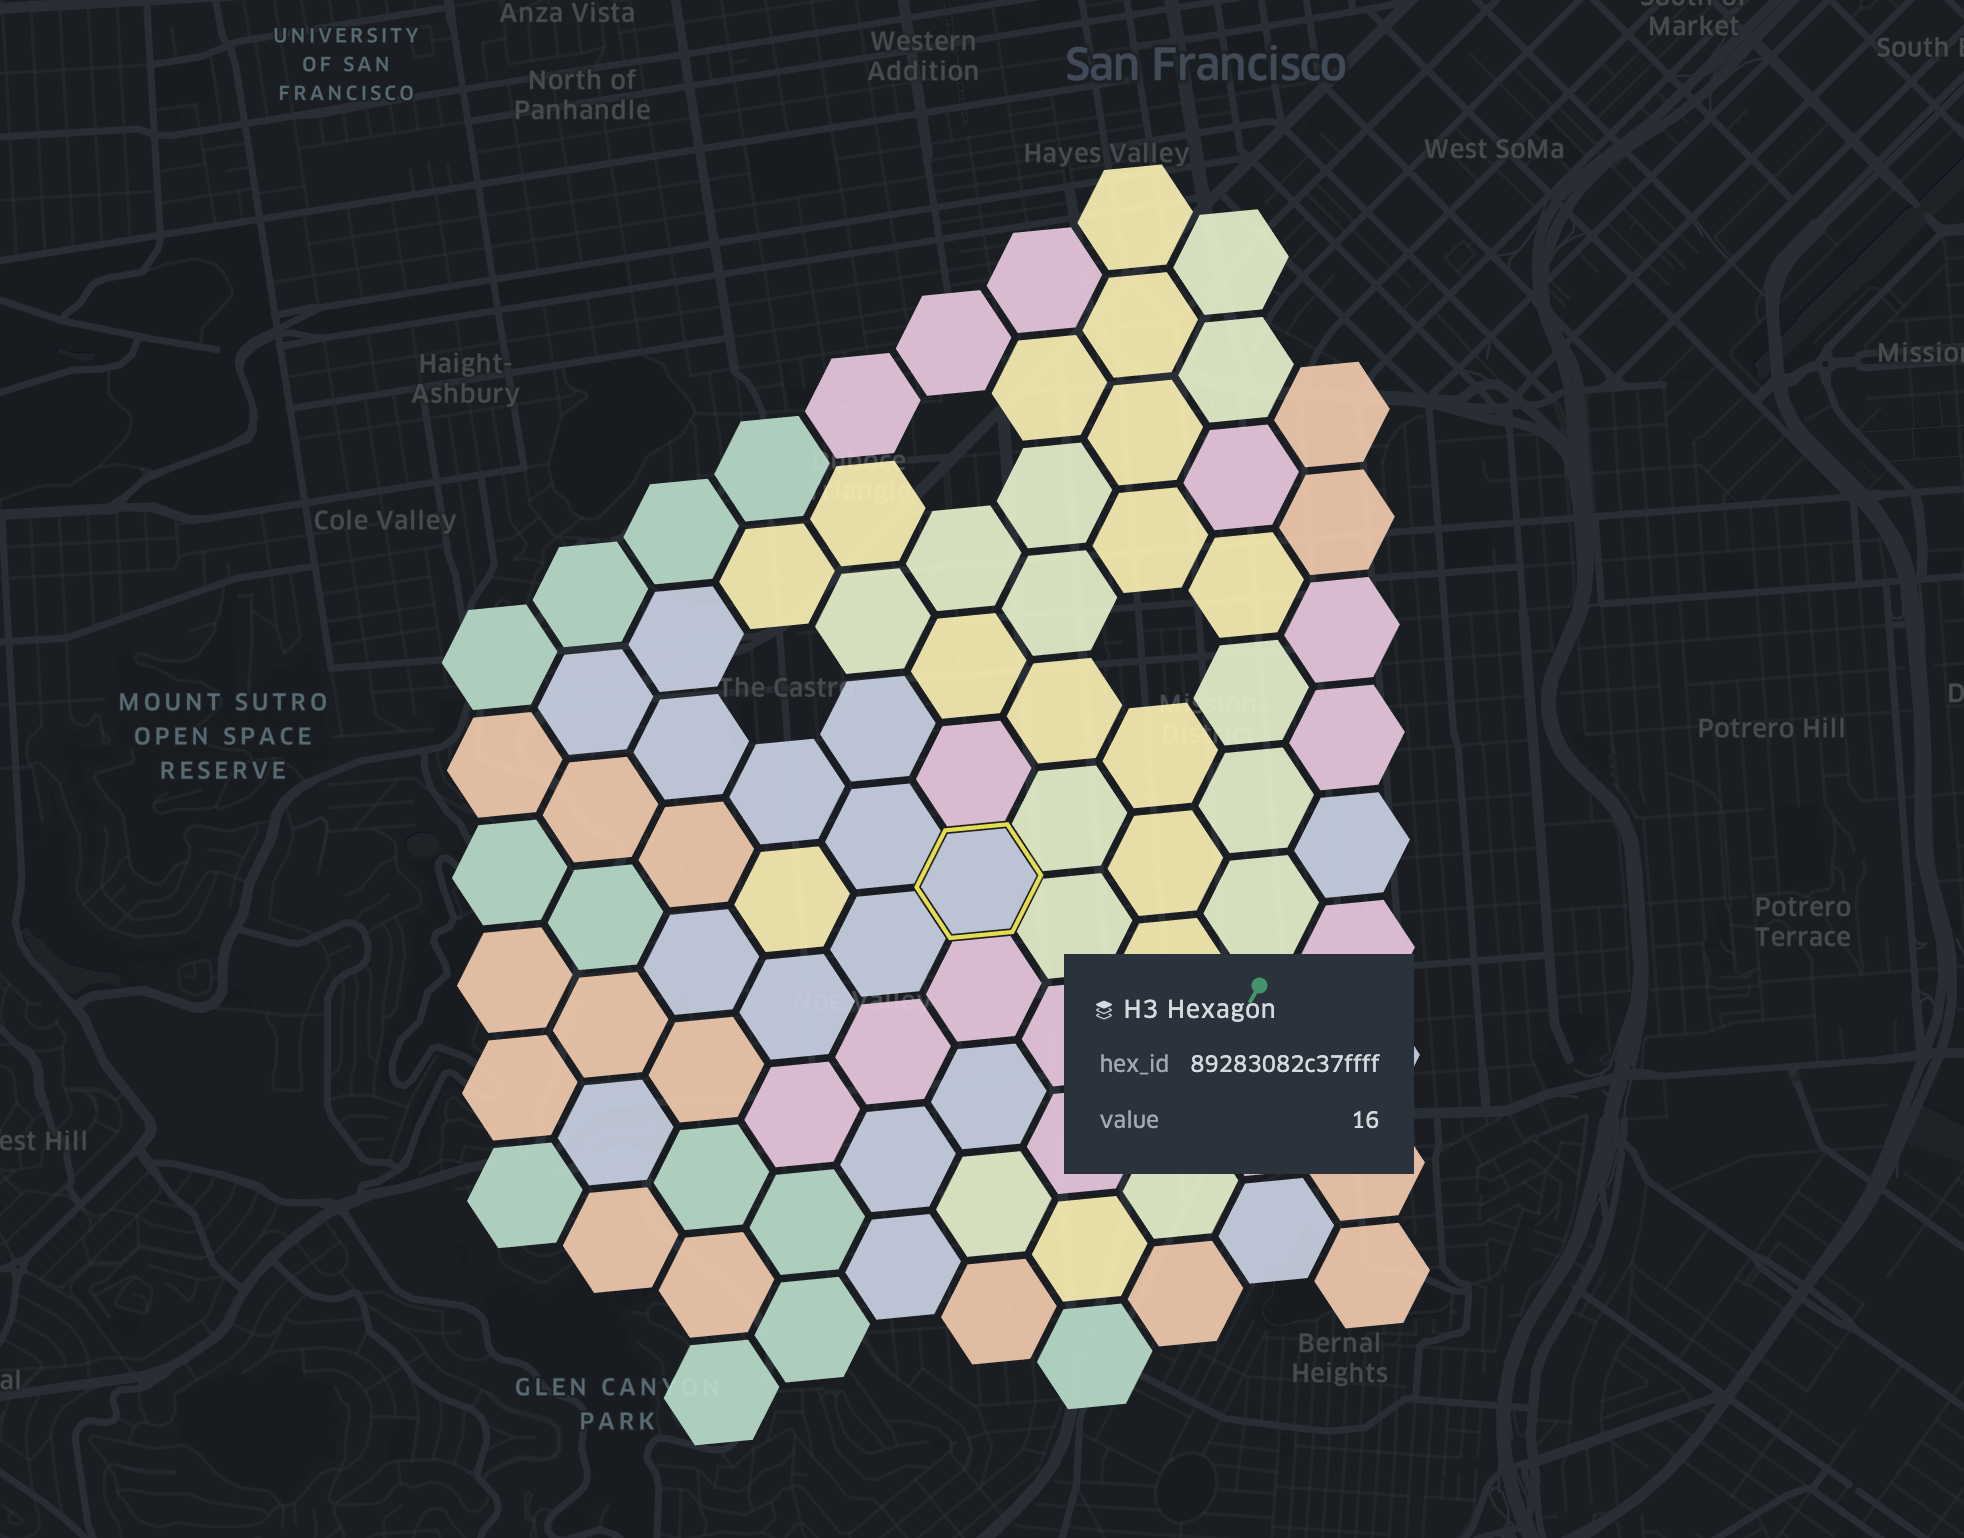
Hexbin aggregates points into hexagons. The counts can be represented through color and/or height.
Layer Attributes: Color/ Color Based On, Filter by Count Percentile, Opacity, Hexagon Radius (km), Coverage (Radius), Enable Height, Elevation Scale/ Height Based On, High Precision Rendering
Heatmap
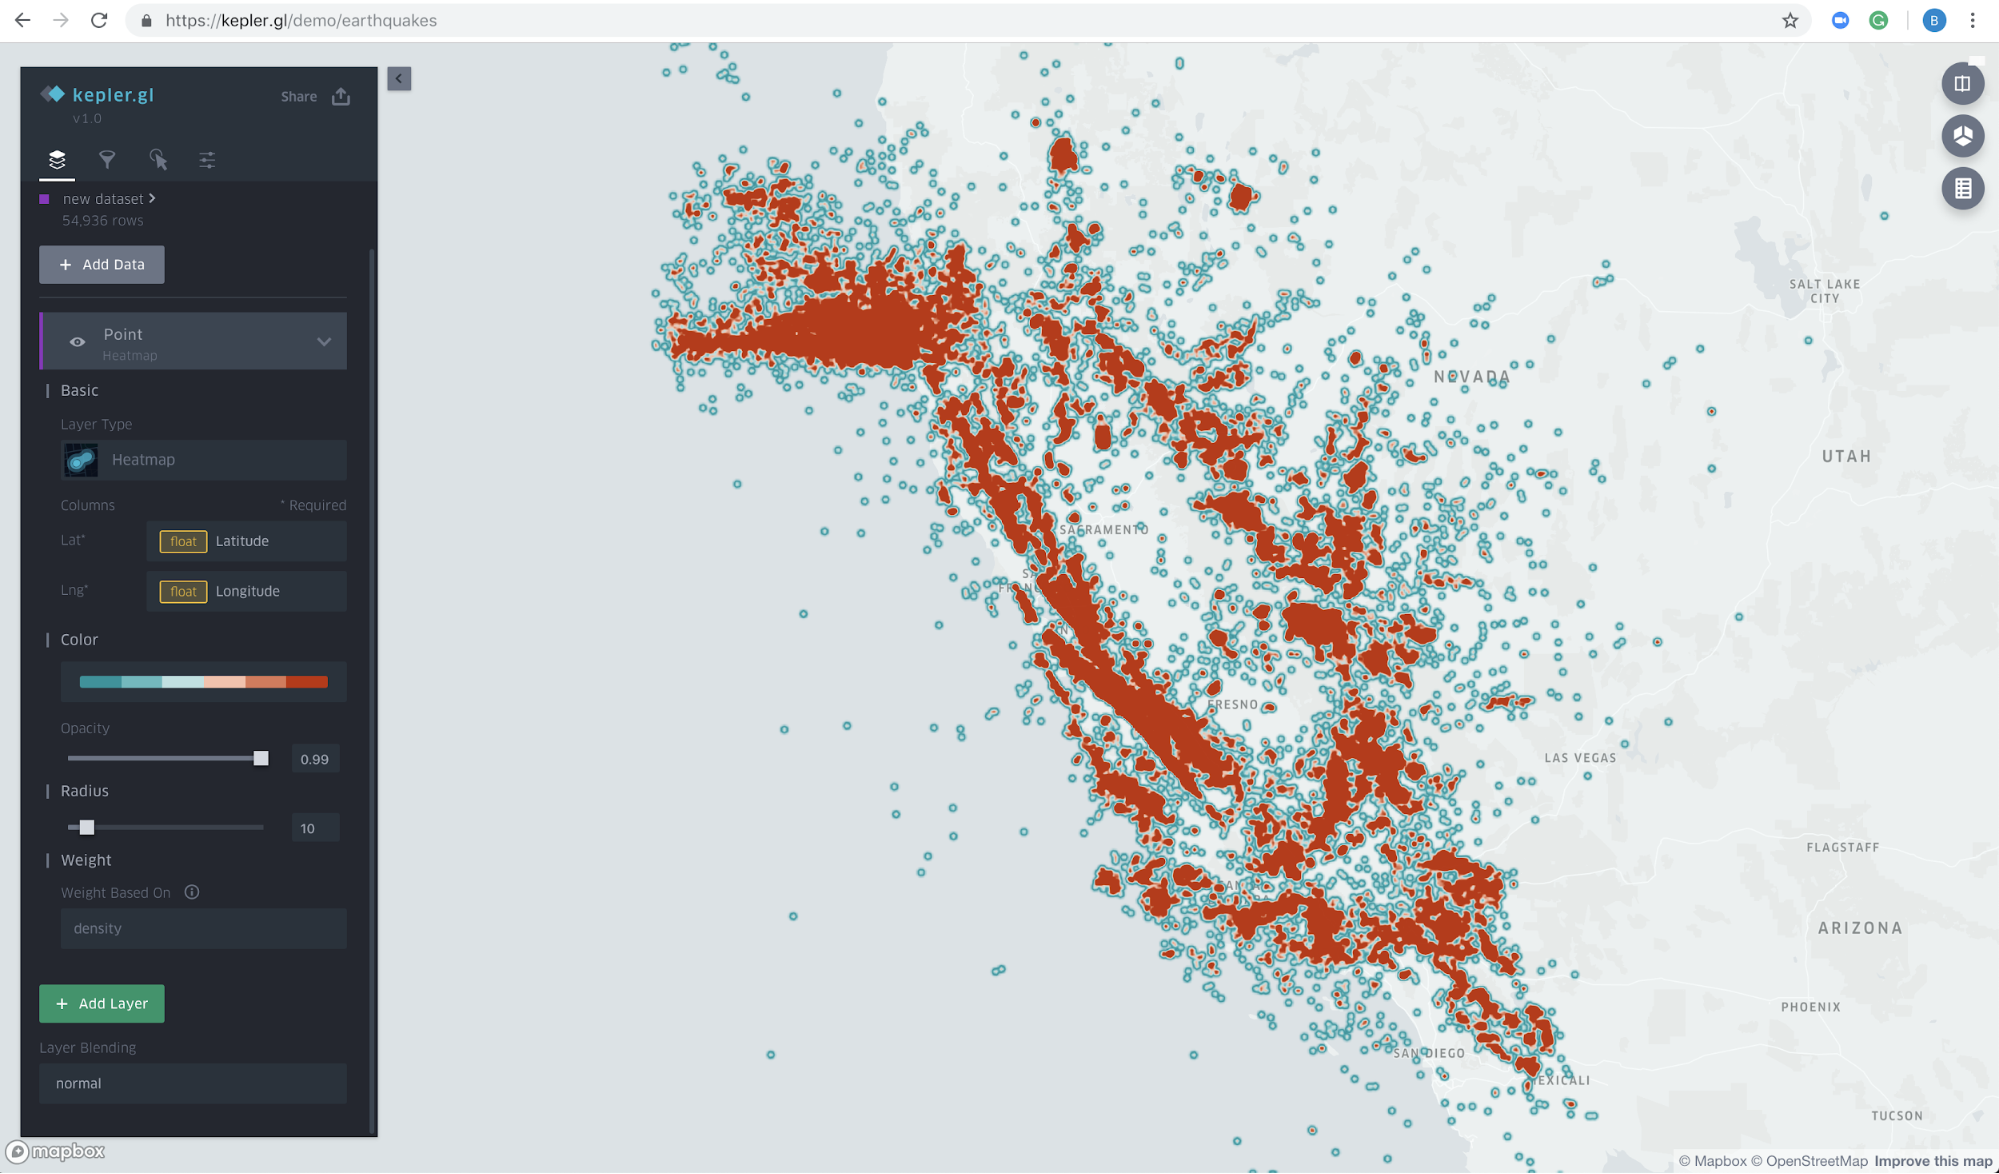
Heatmap is a graphical representation of data in which data values are represented as colors.
Layer Attributes: Color, Opacity, Radius, Weight
Cluster
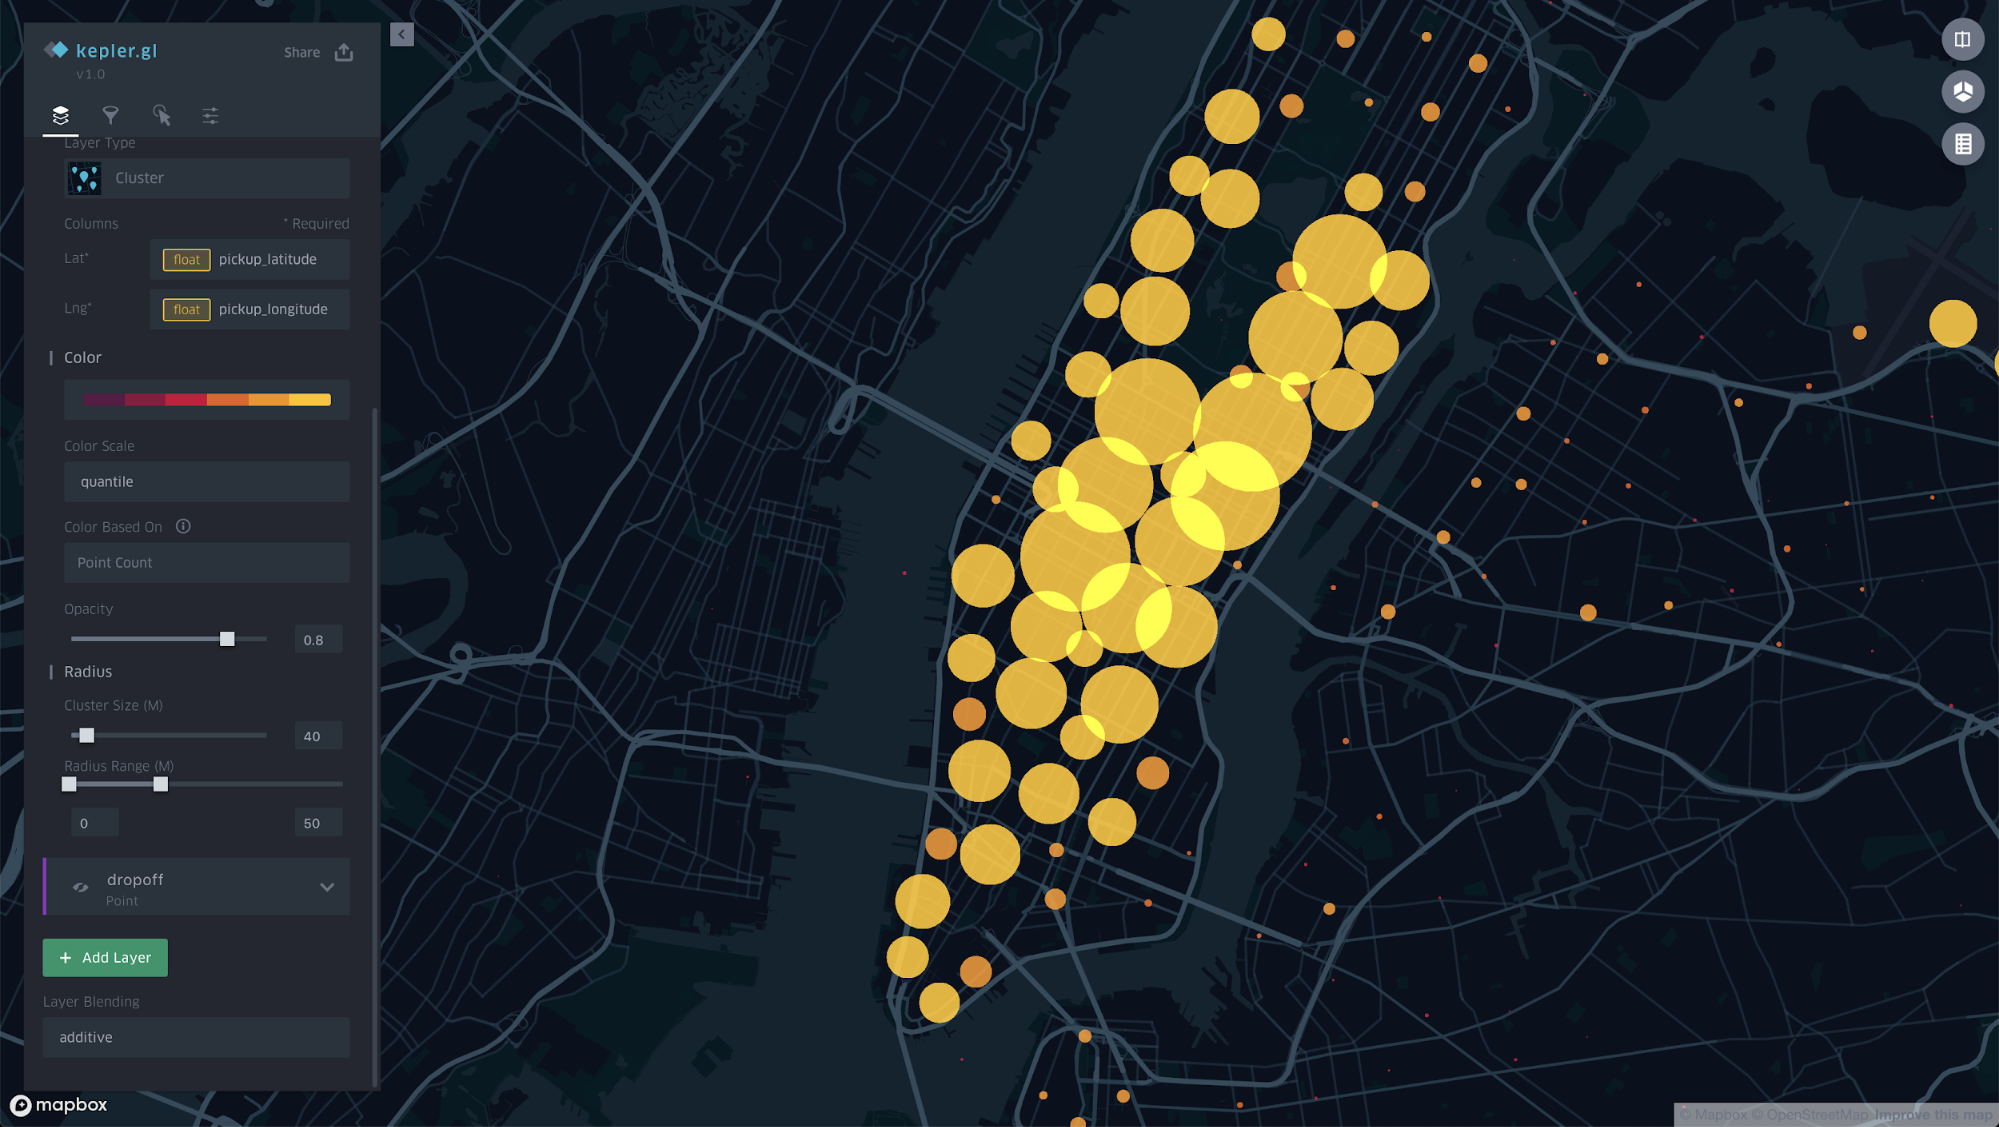
Cluster layers visualize aggregated data based on a geospatial radius.
Layer Attributes: Color, Cluster Size
Icon
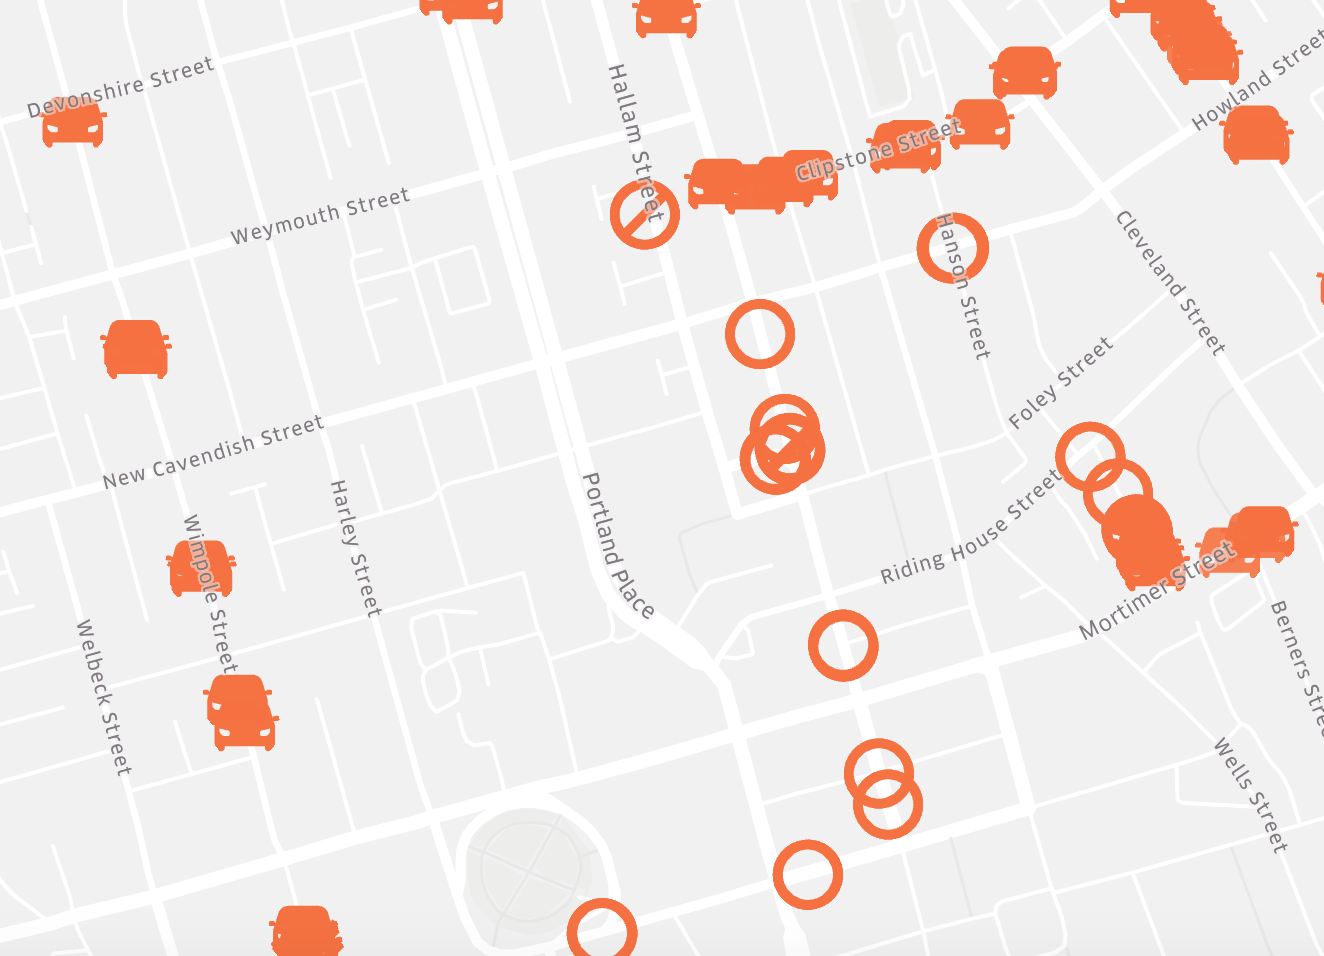
Icon layers are a type of point layer. They allow you to differentiate between points by assigning icons to points based on a field. For example, you might use icons to differentiate between types of venues and points of interest.
Layer Attributes: Color, Radius, Label, High Precision Rendering
To see the icon menu, create a new icon layer and click how to draw an icon layer:

Grid
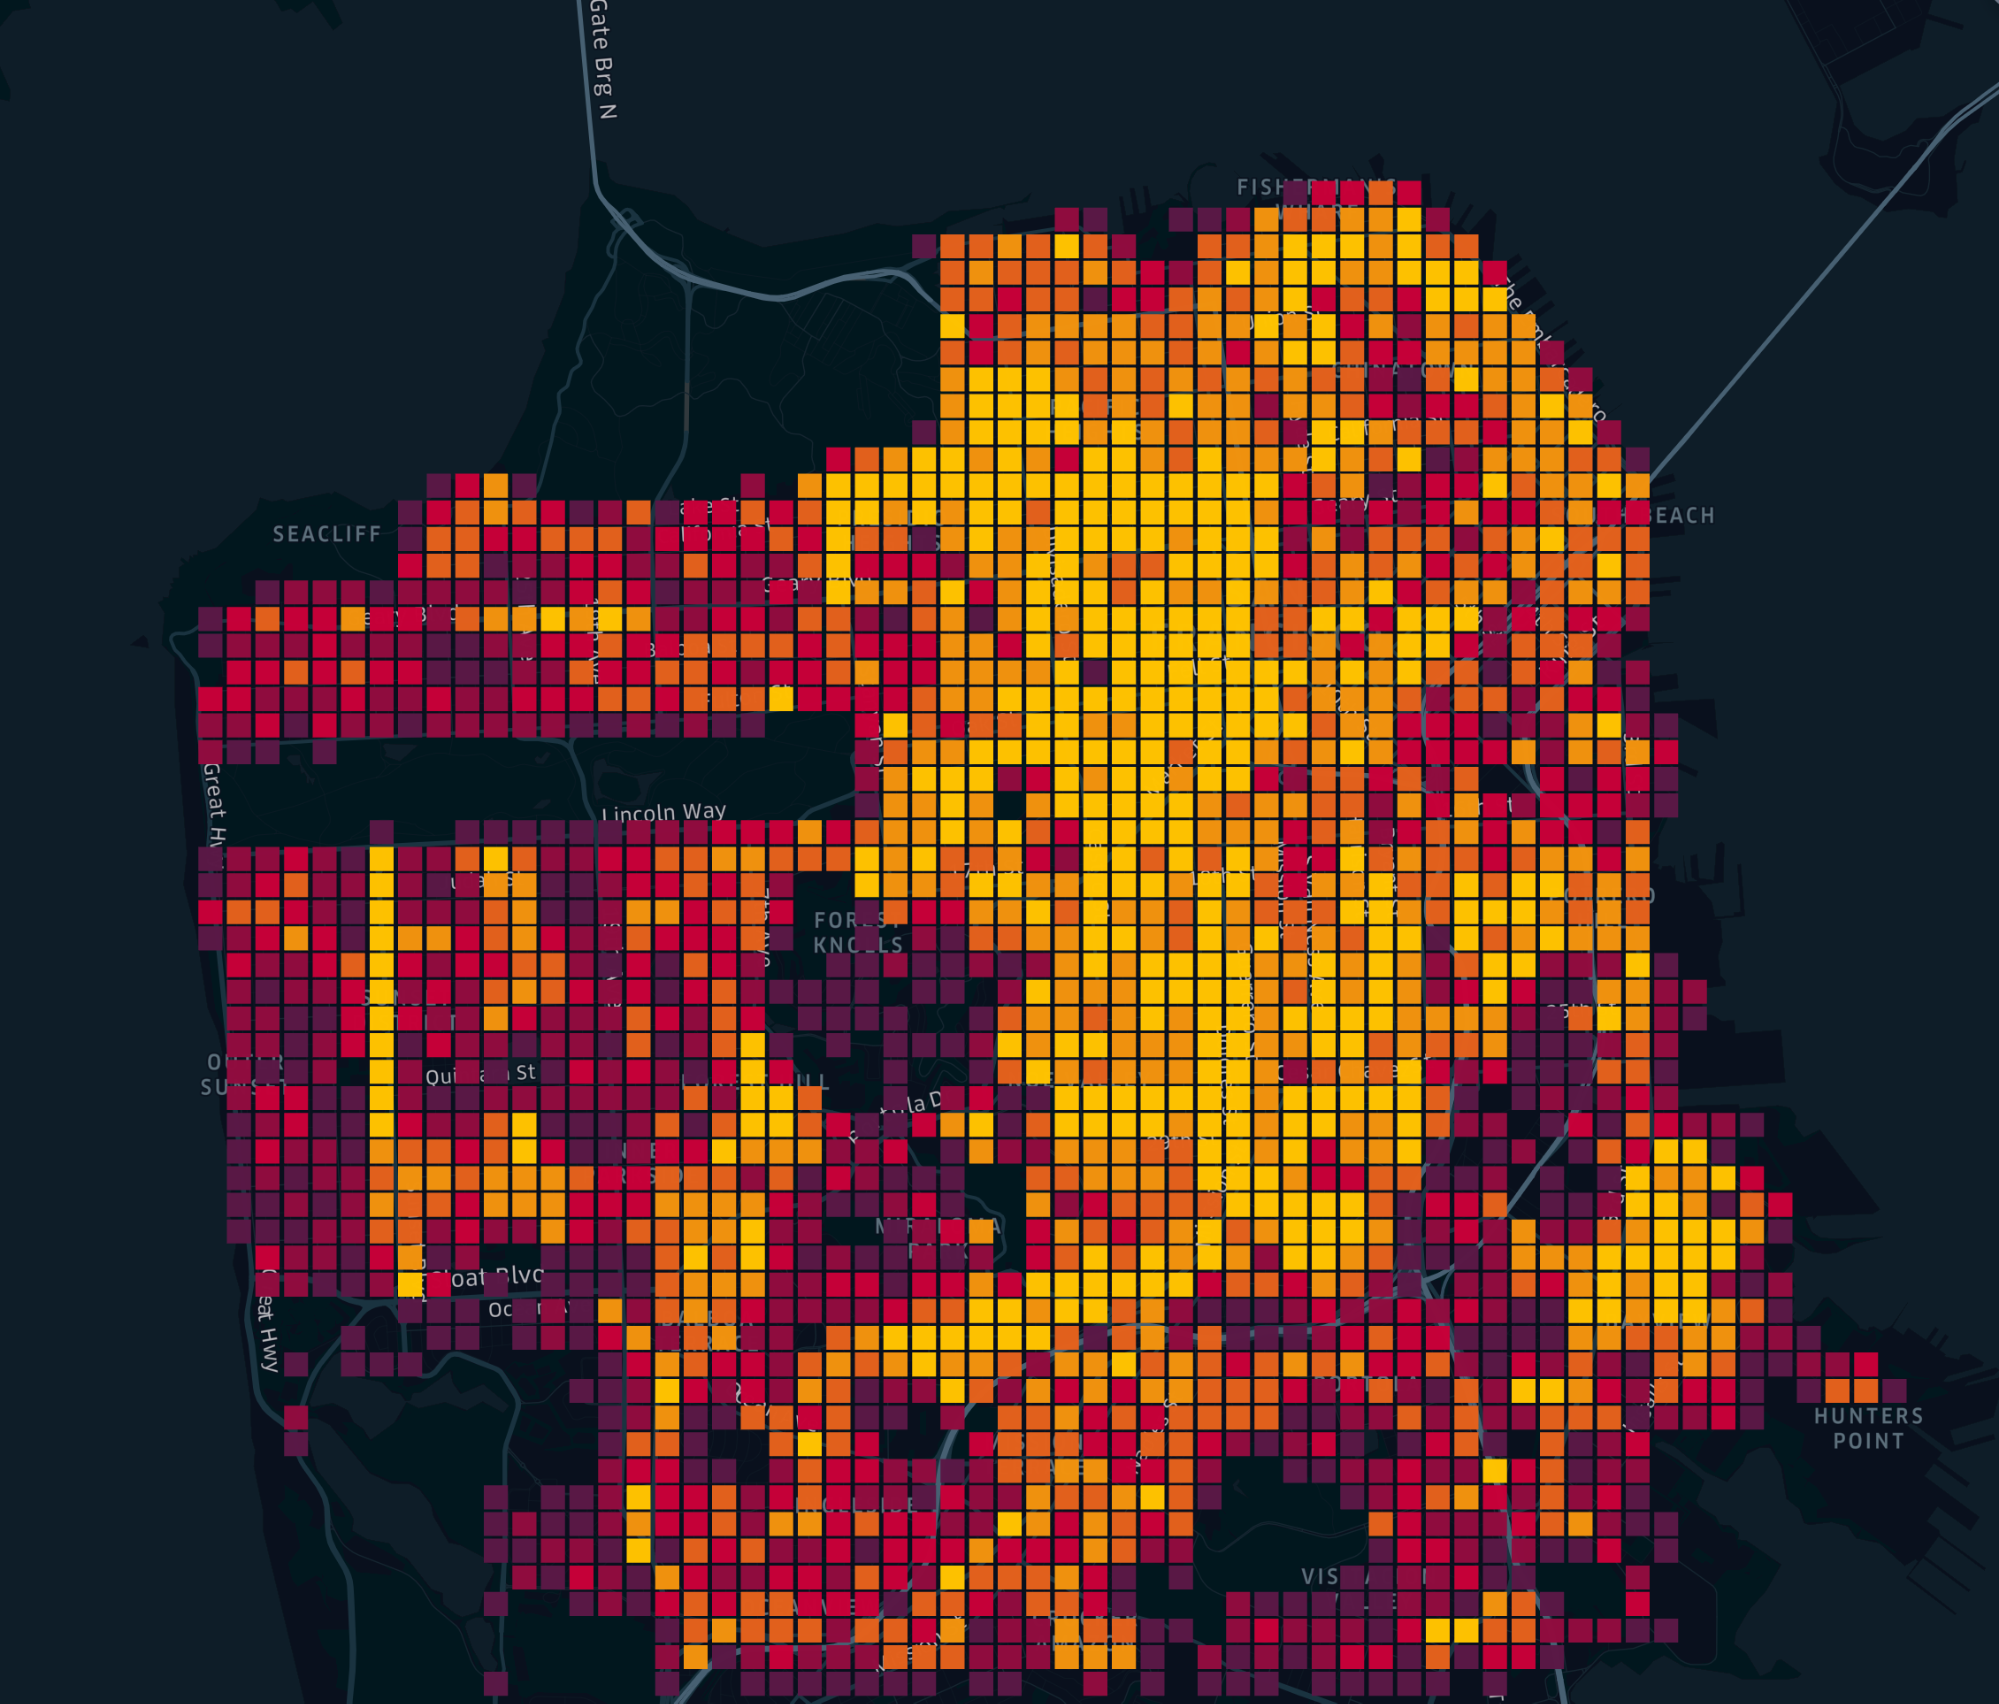
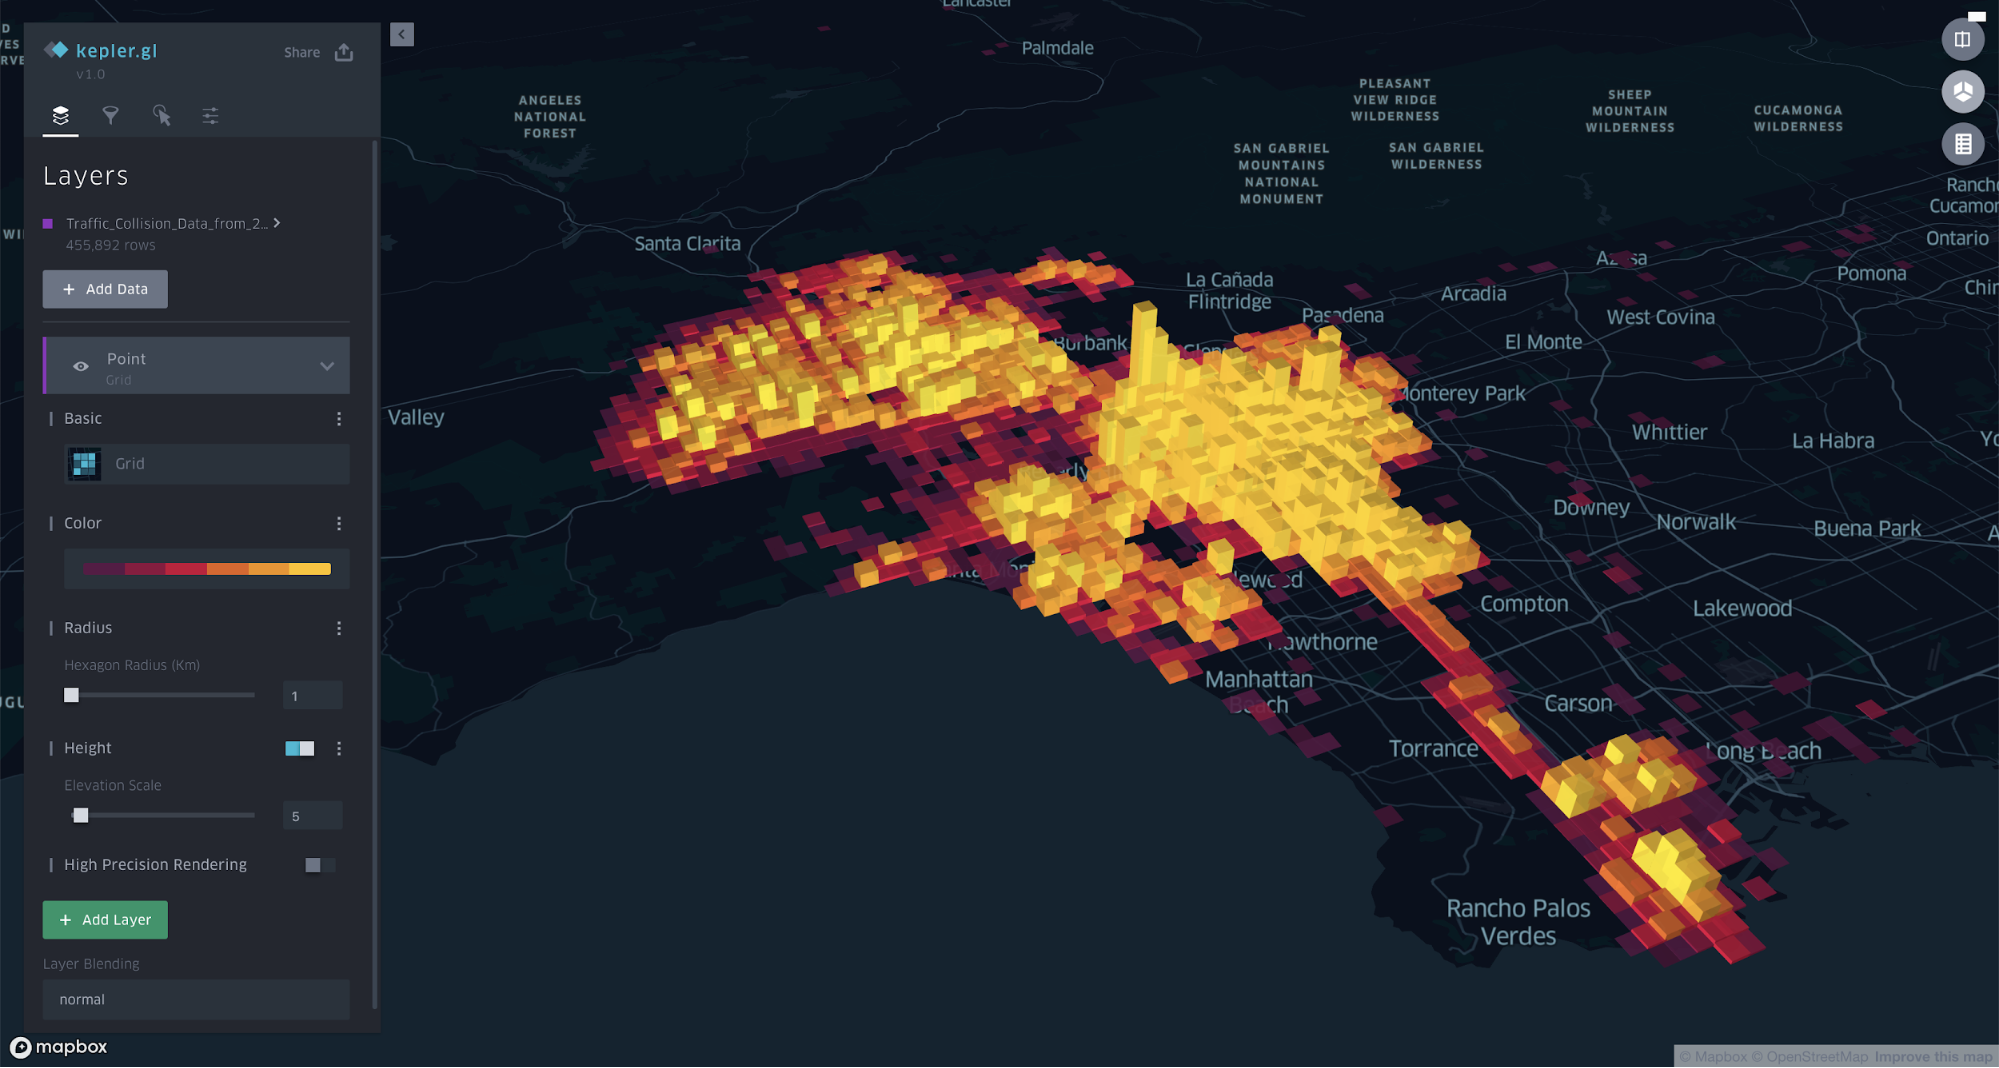
Grids layers are similar to heatmaps. They show the density of points. They provide visual discrepancy in a map where multiple heatmap-style layers are present.
Layer Attributes: Color, Radius, Height, High Precision Rendering
GeoJSON
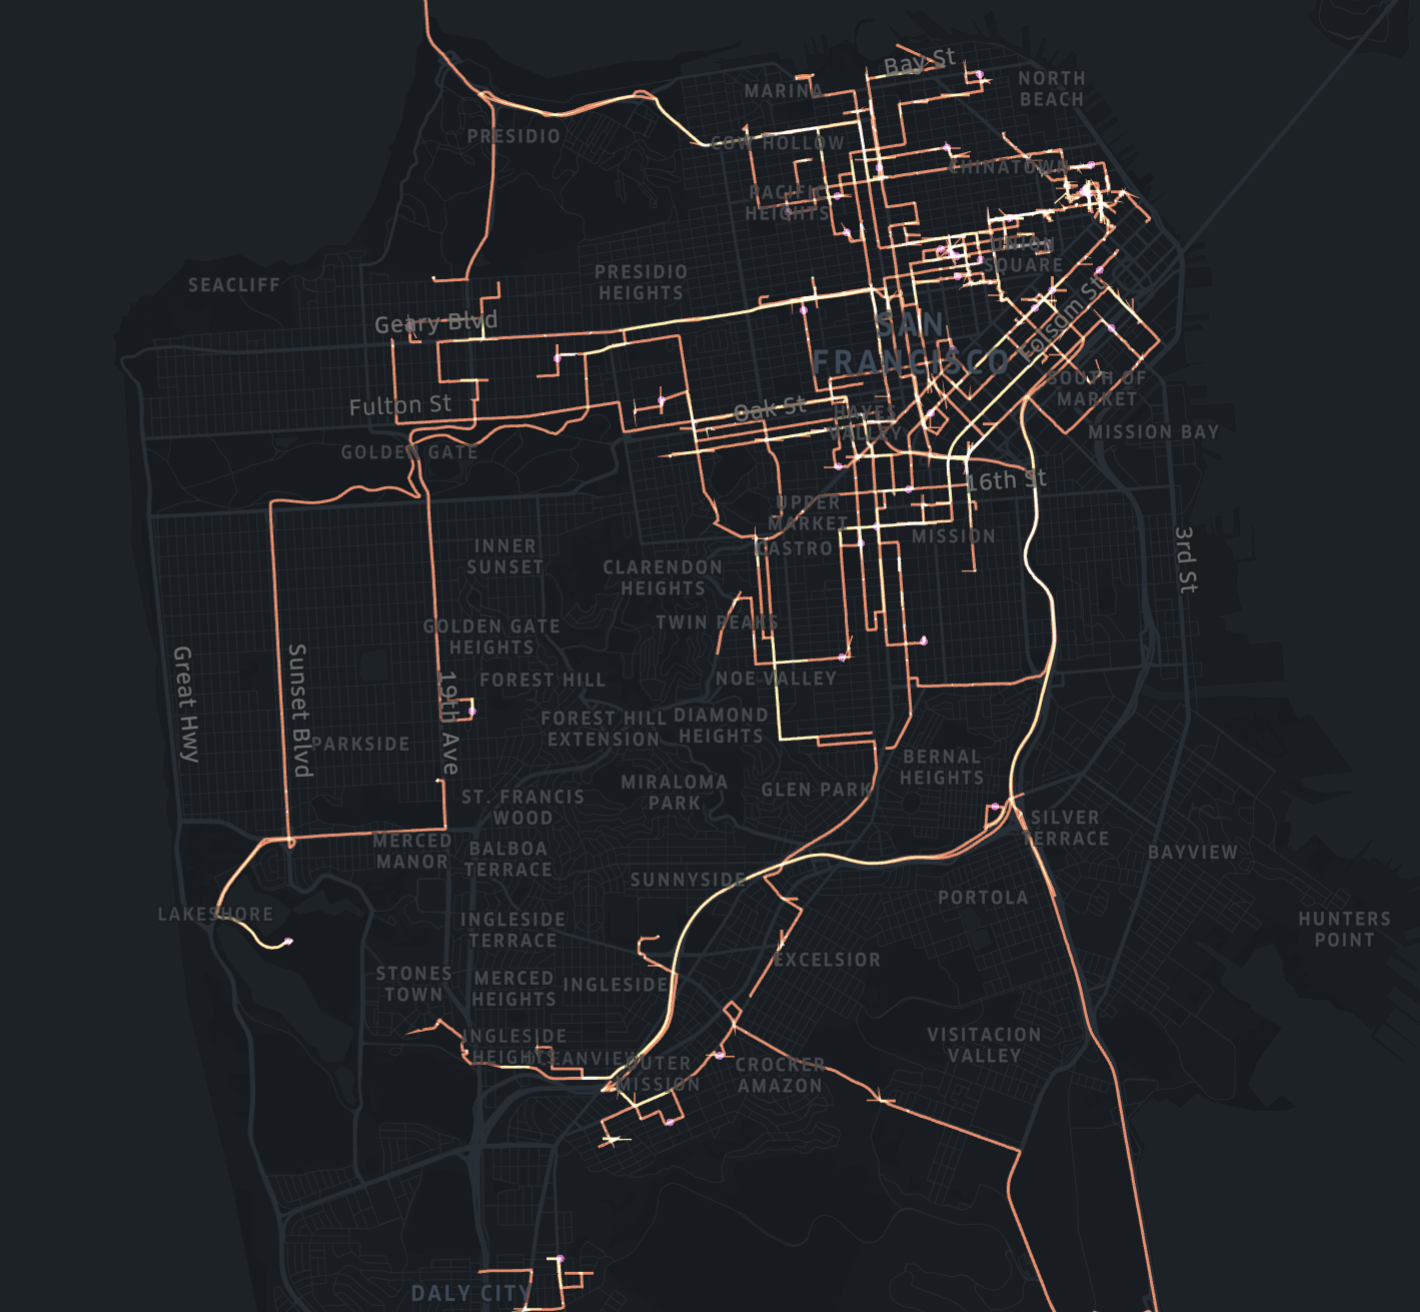
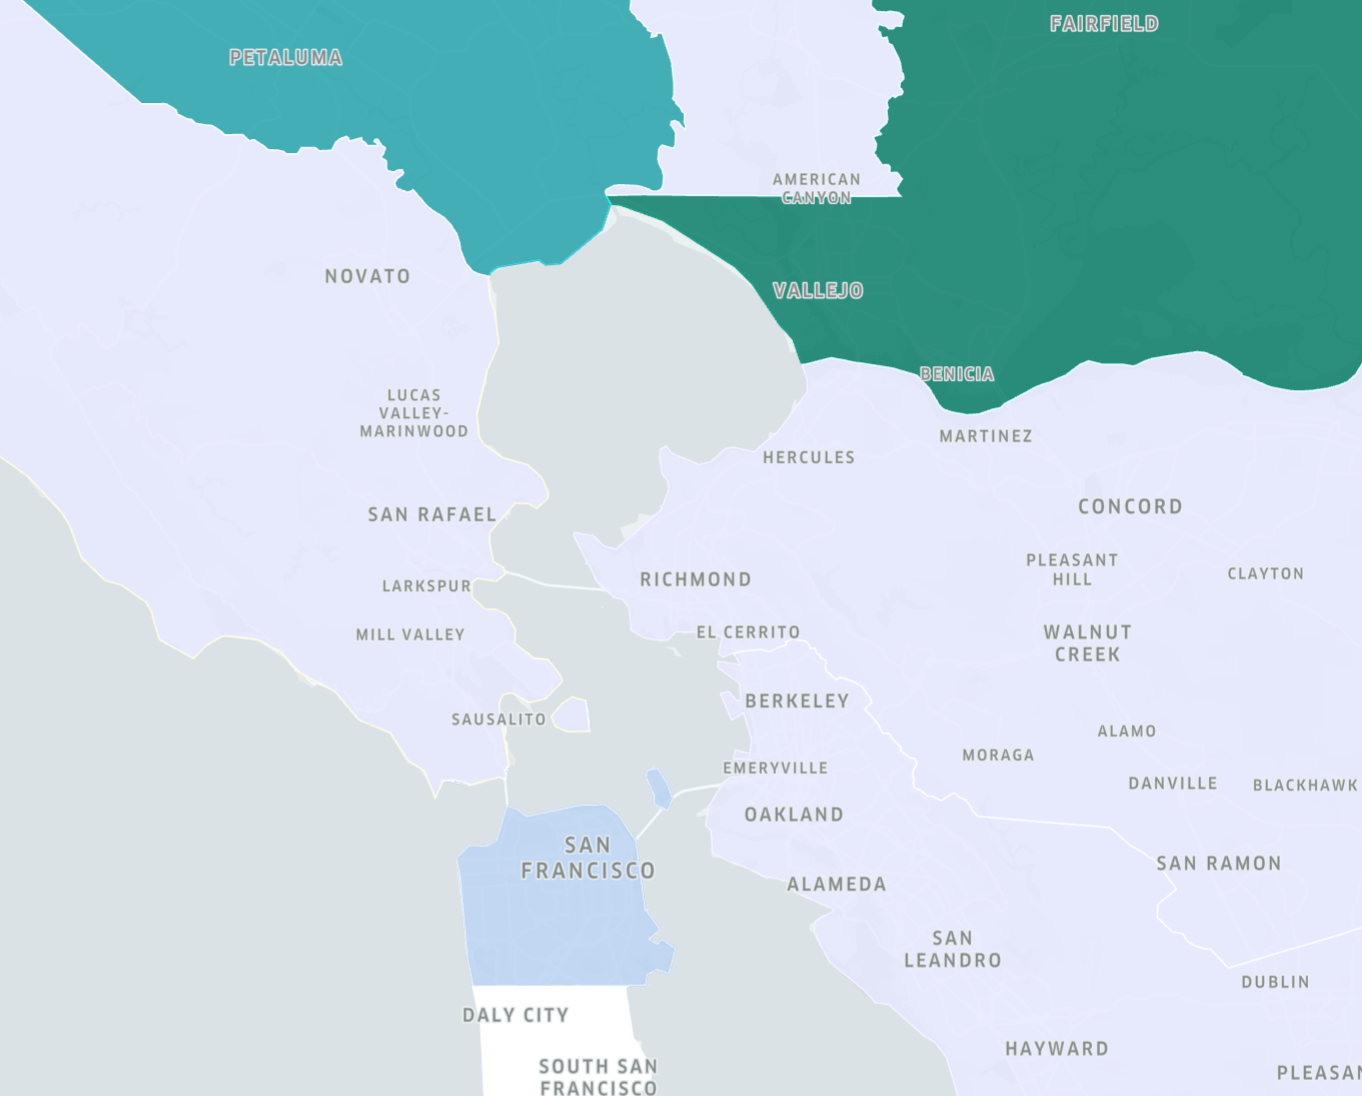
GeoJSON layers can display either paths, polygons or points. For example, a path GeoJSON layer can display data like trip routes. A polygon GeoJSON layer is essentially a choropleth layer and works best for rendering geofences. To add a GeoJSON layer, your dataset must contain geometry data.
H3
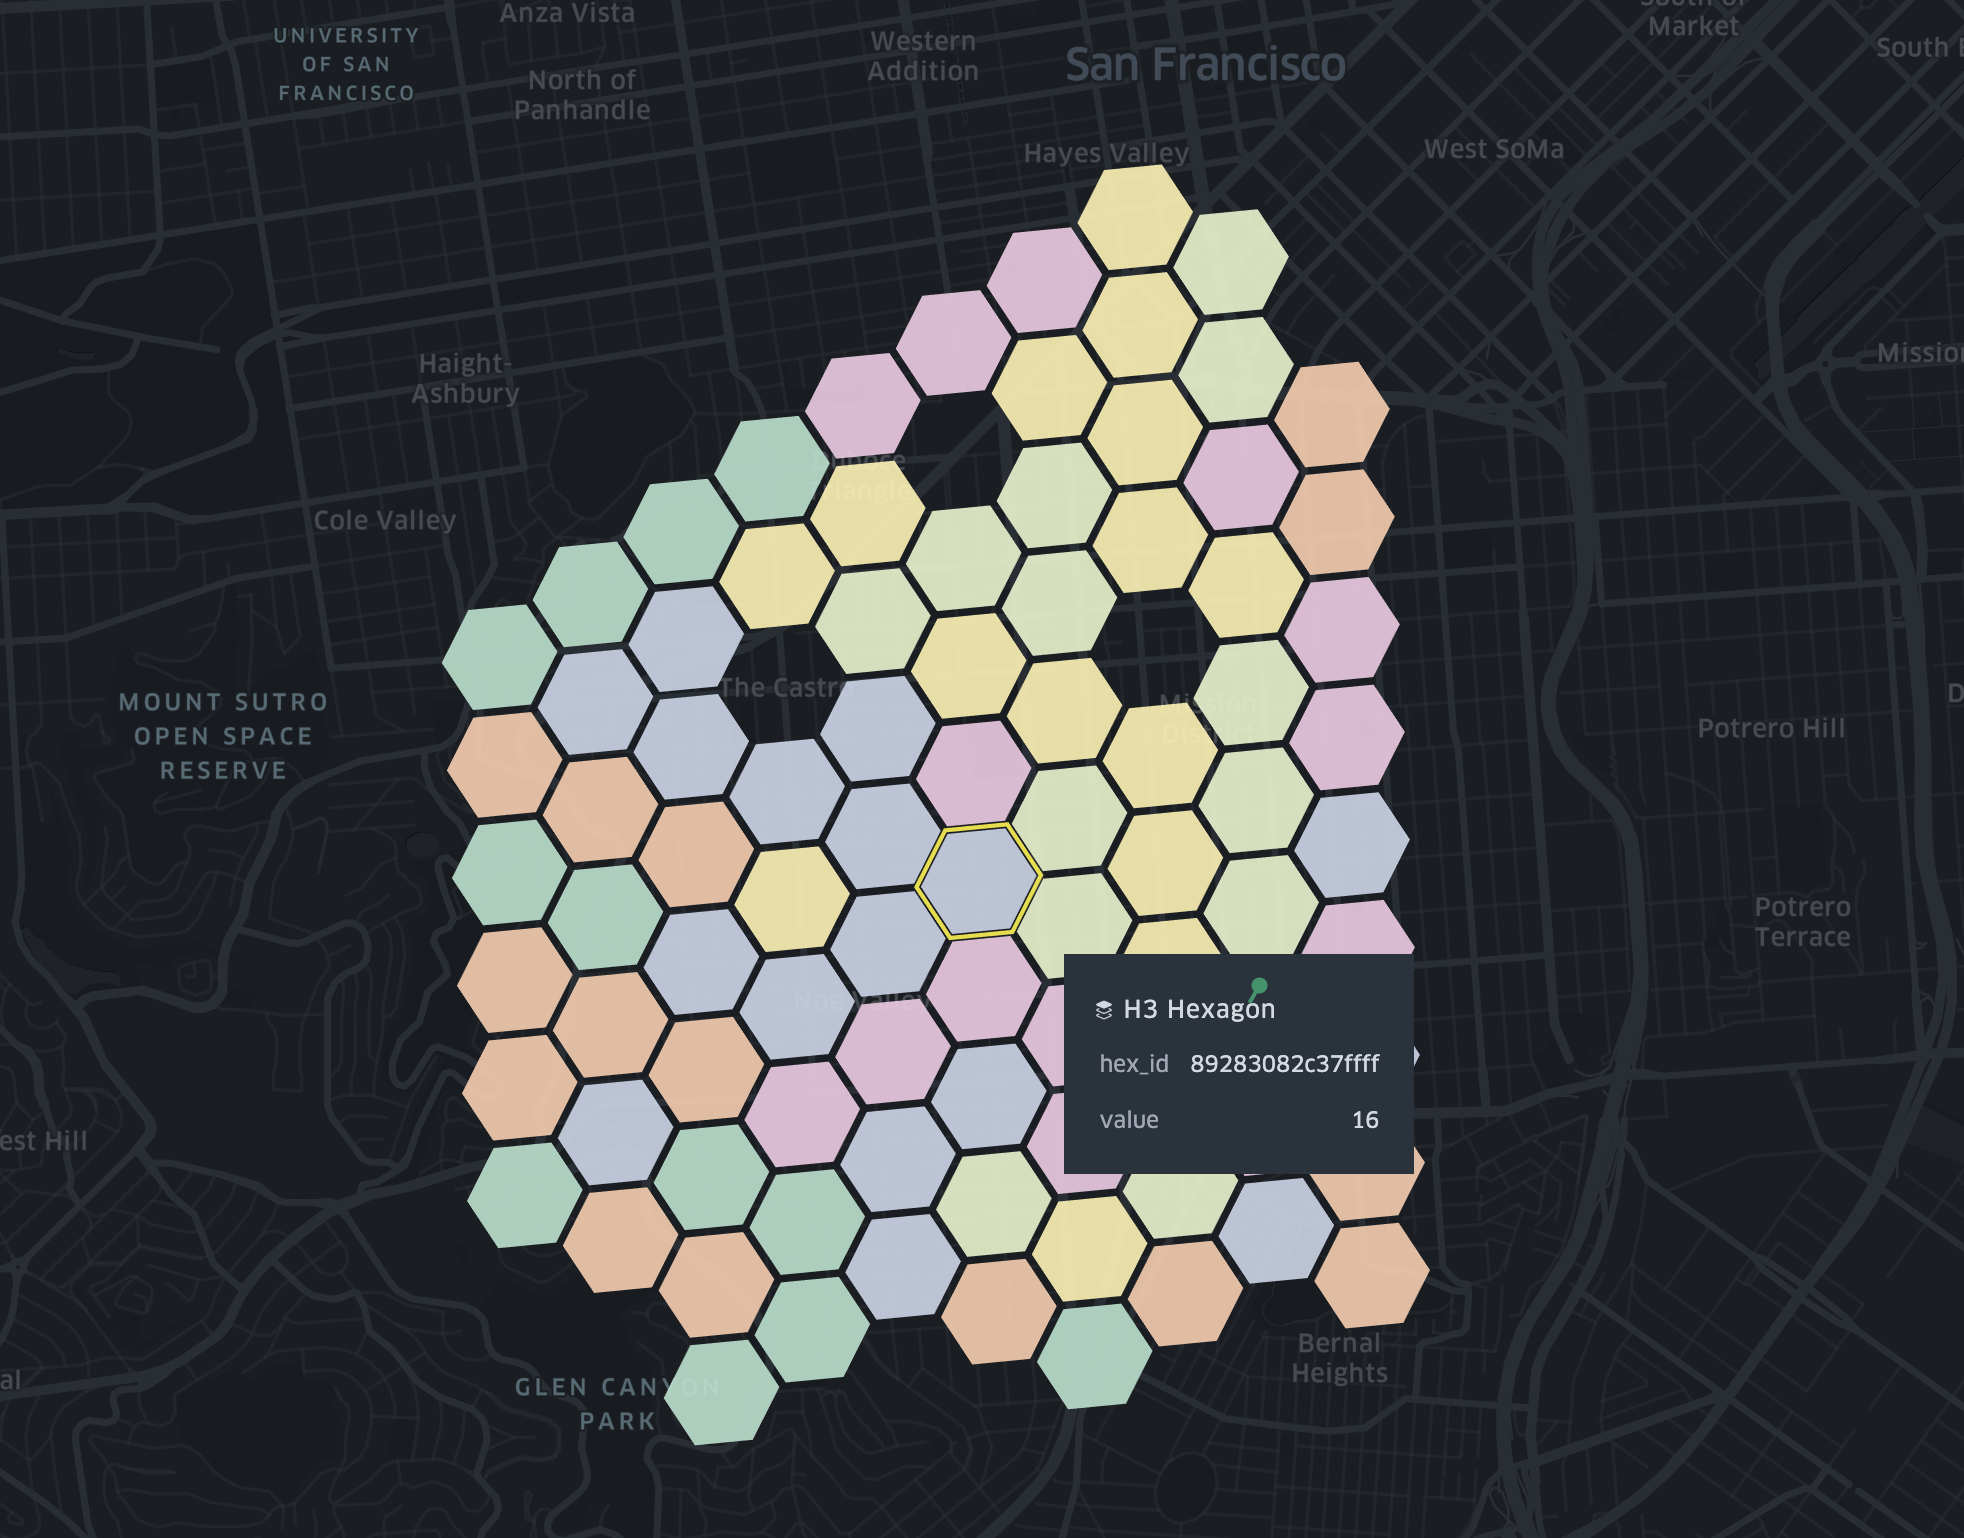
H3 layers visualize spatial data using H3 Hexagonal Hierarchical Spatial Index.
To use H3 layer, you need a hex_id in your dataset, which can be generated using h3-js from latitude, longitude and resolution.
S2 Layer
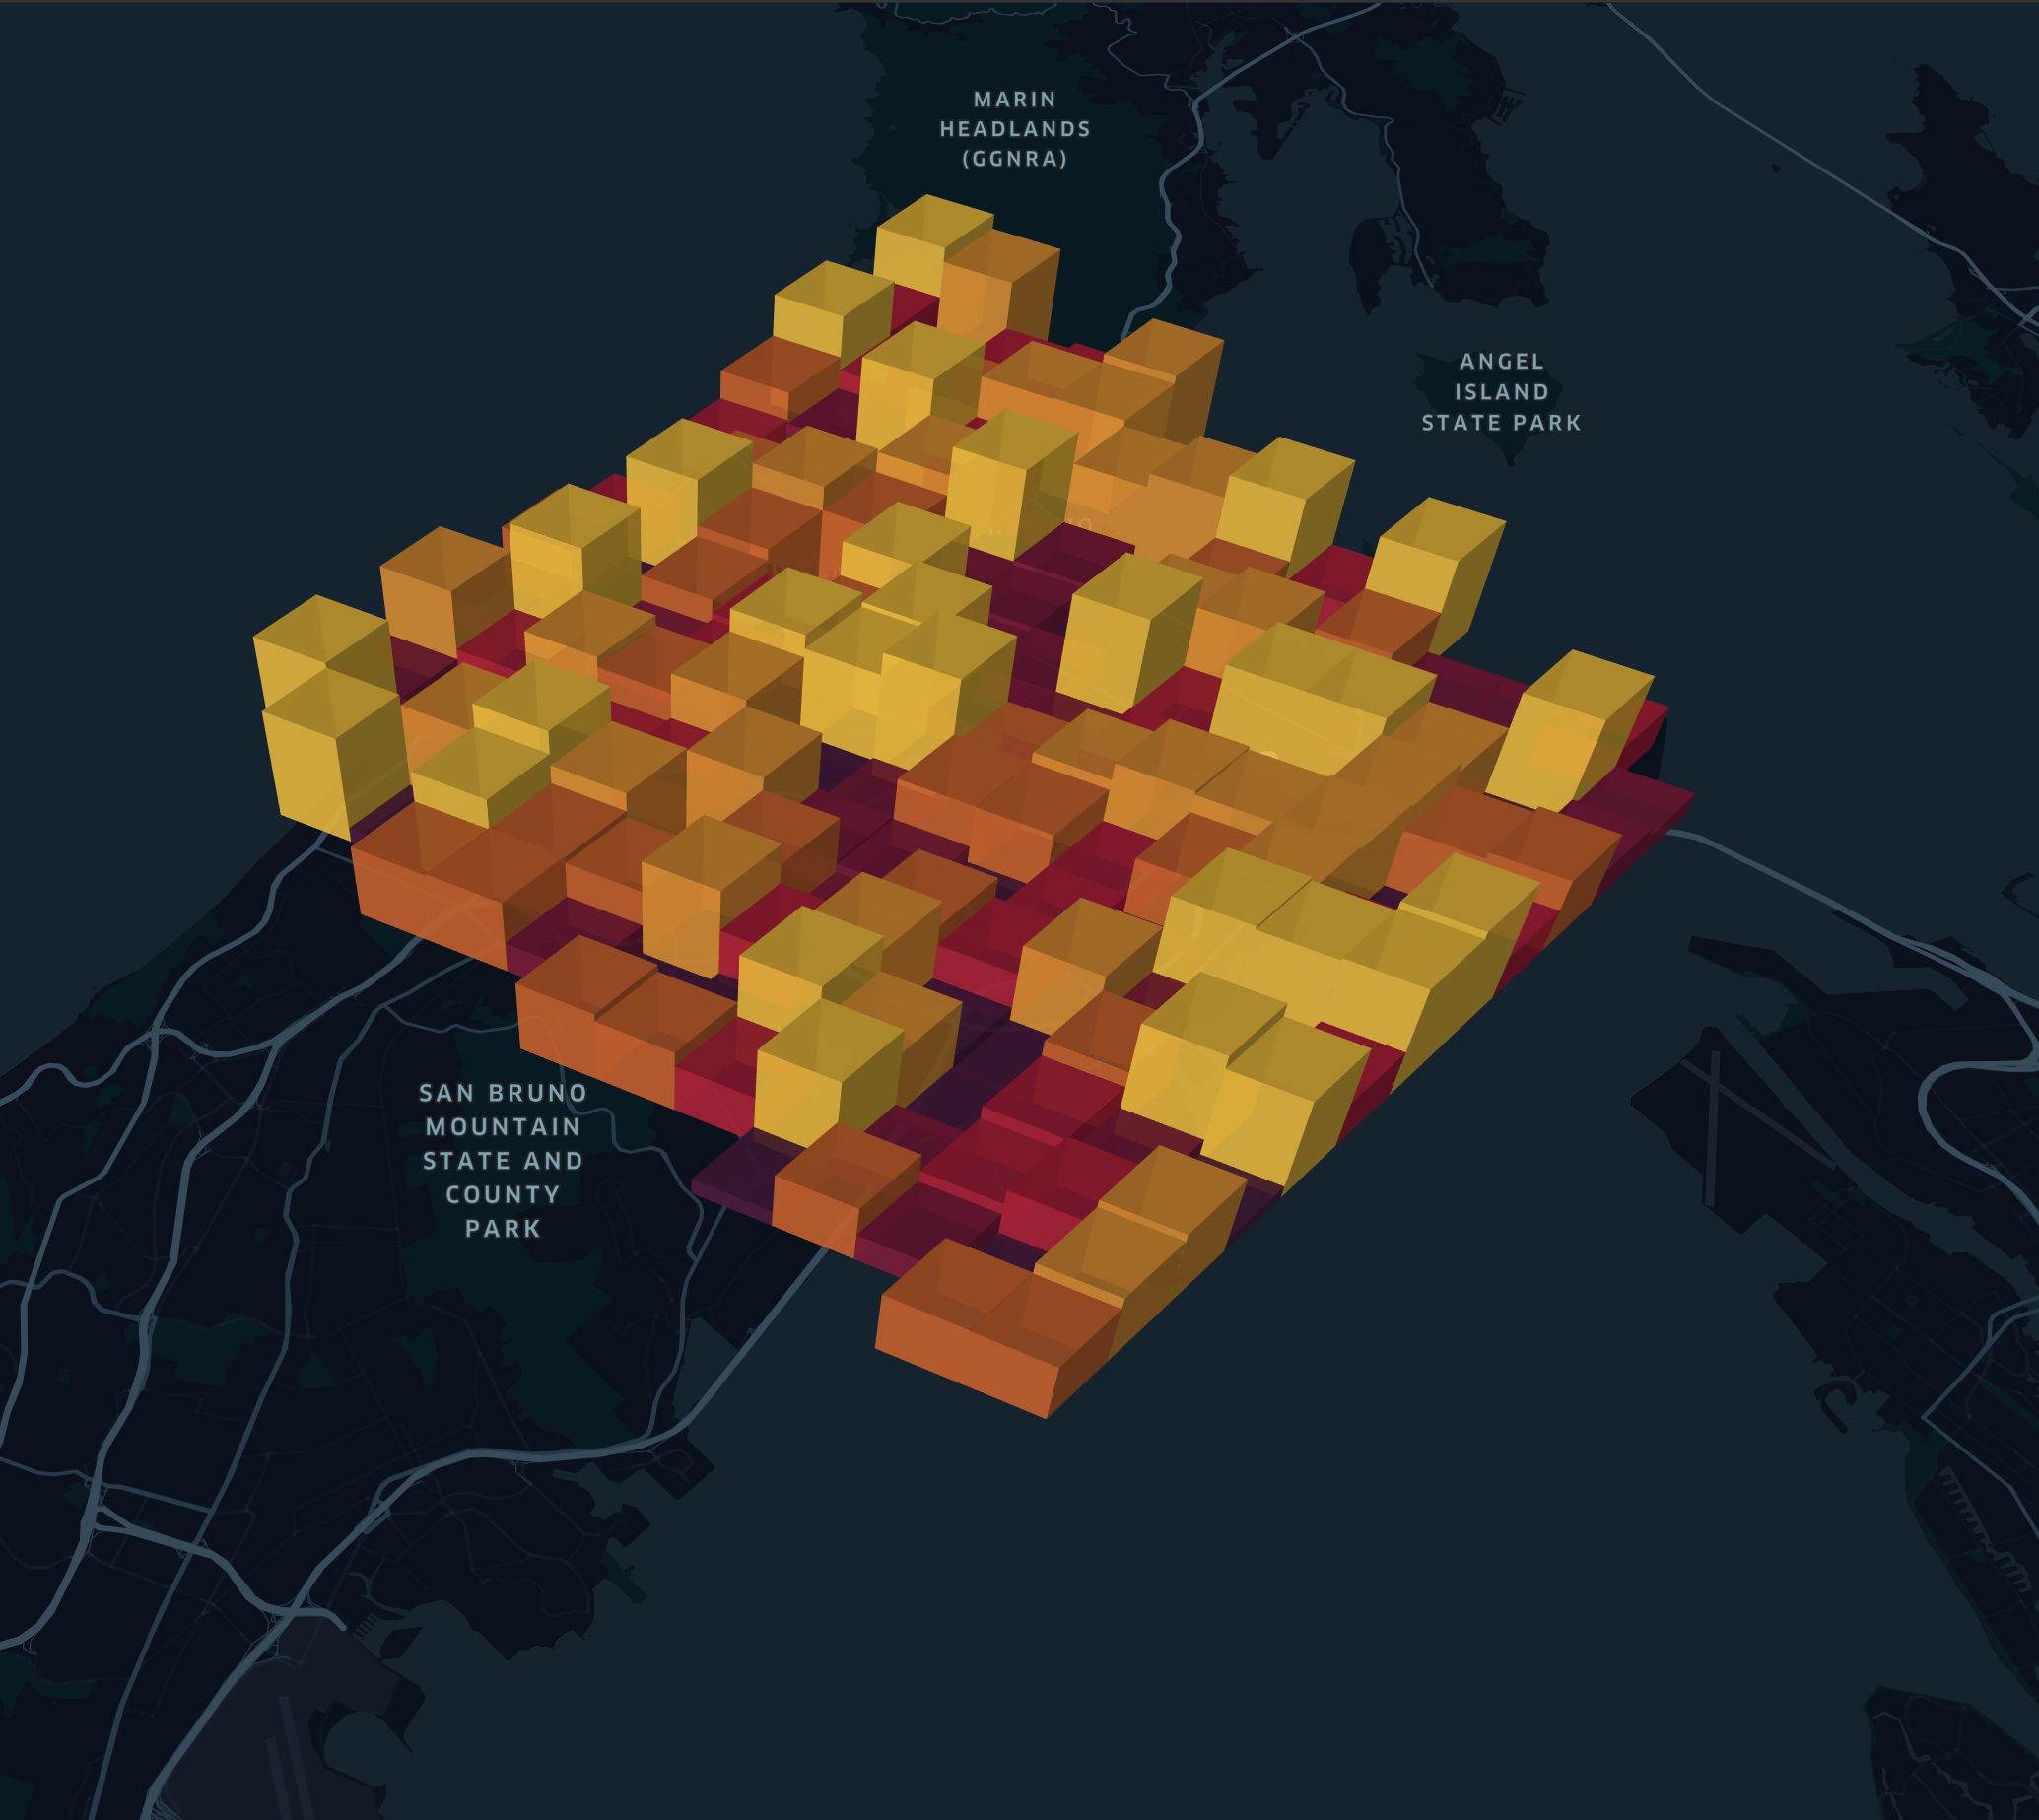
To use S2 layer, you need to assign a column containing S2 tokens.
Vector Tile Layer
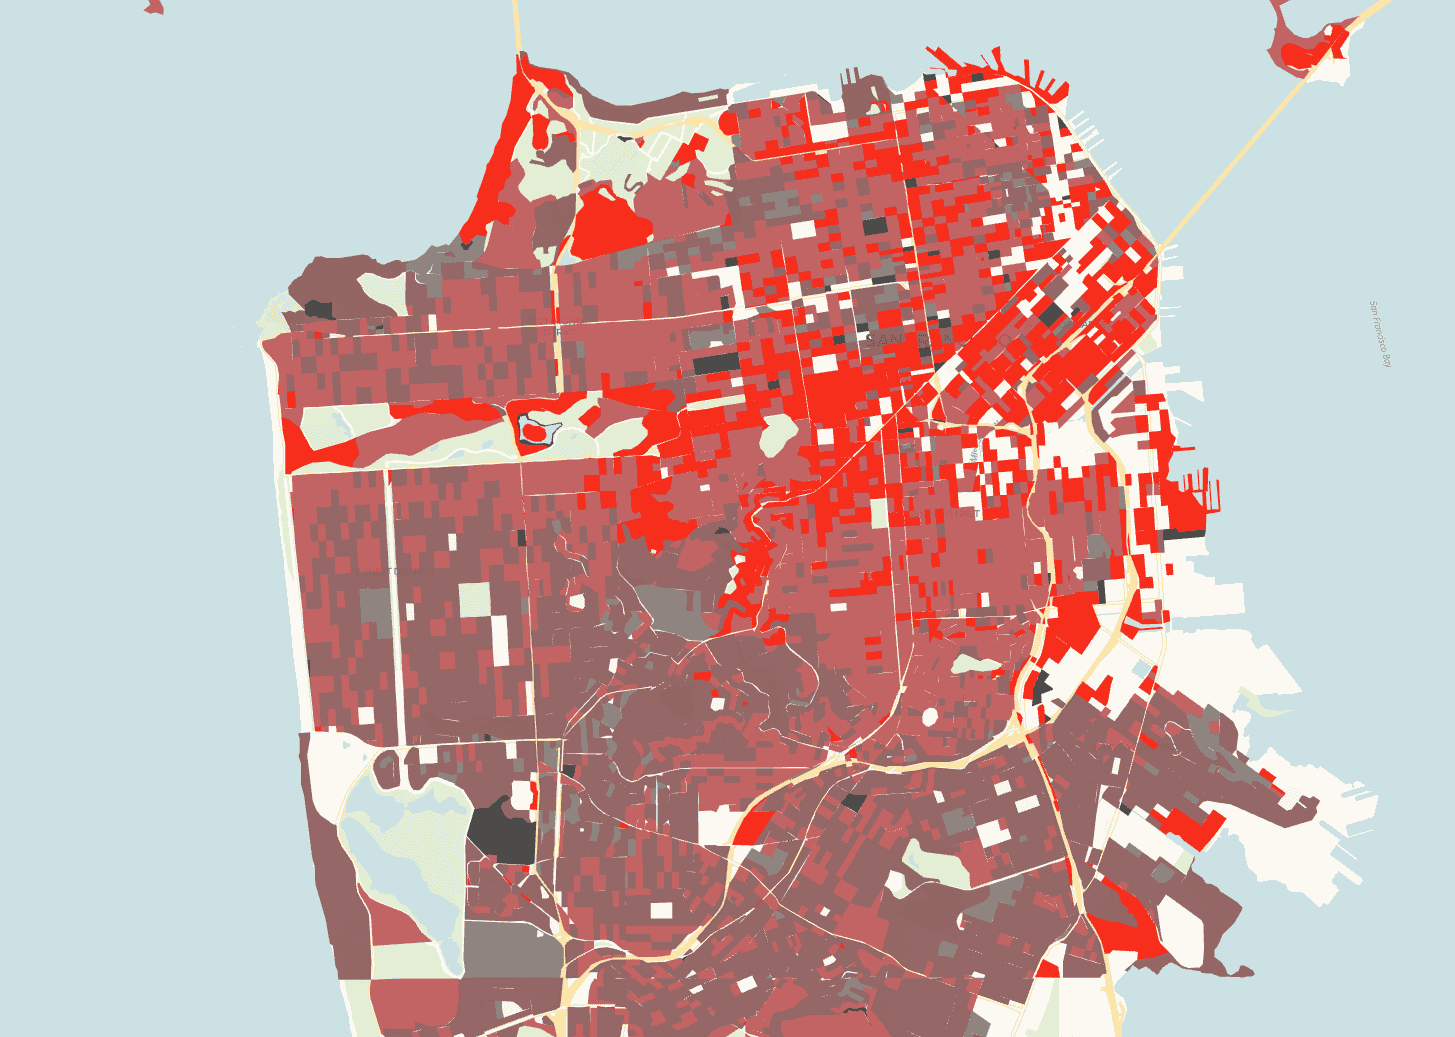
Vector Tile Layer makes it possible to visualize very large datasets through MVTs (Mapbox Vector Tiles). To optimize performance, the layer only loads and renders tiles containing features that are visible within the current viewport.
Supported URL templates:
MVT (https://api.mapbox.com/v4/mapbox.mapbox-streets-v8/{z}/{x}/{y}.mvt?access_token=your-mapbox-acceess-token)
pmtiles (https://your-cdn/filename.pmtiles)
For step-by-step instructions, see Vector Tile Layer — How to add.
Raster Tile Layer (experimental)
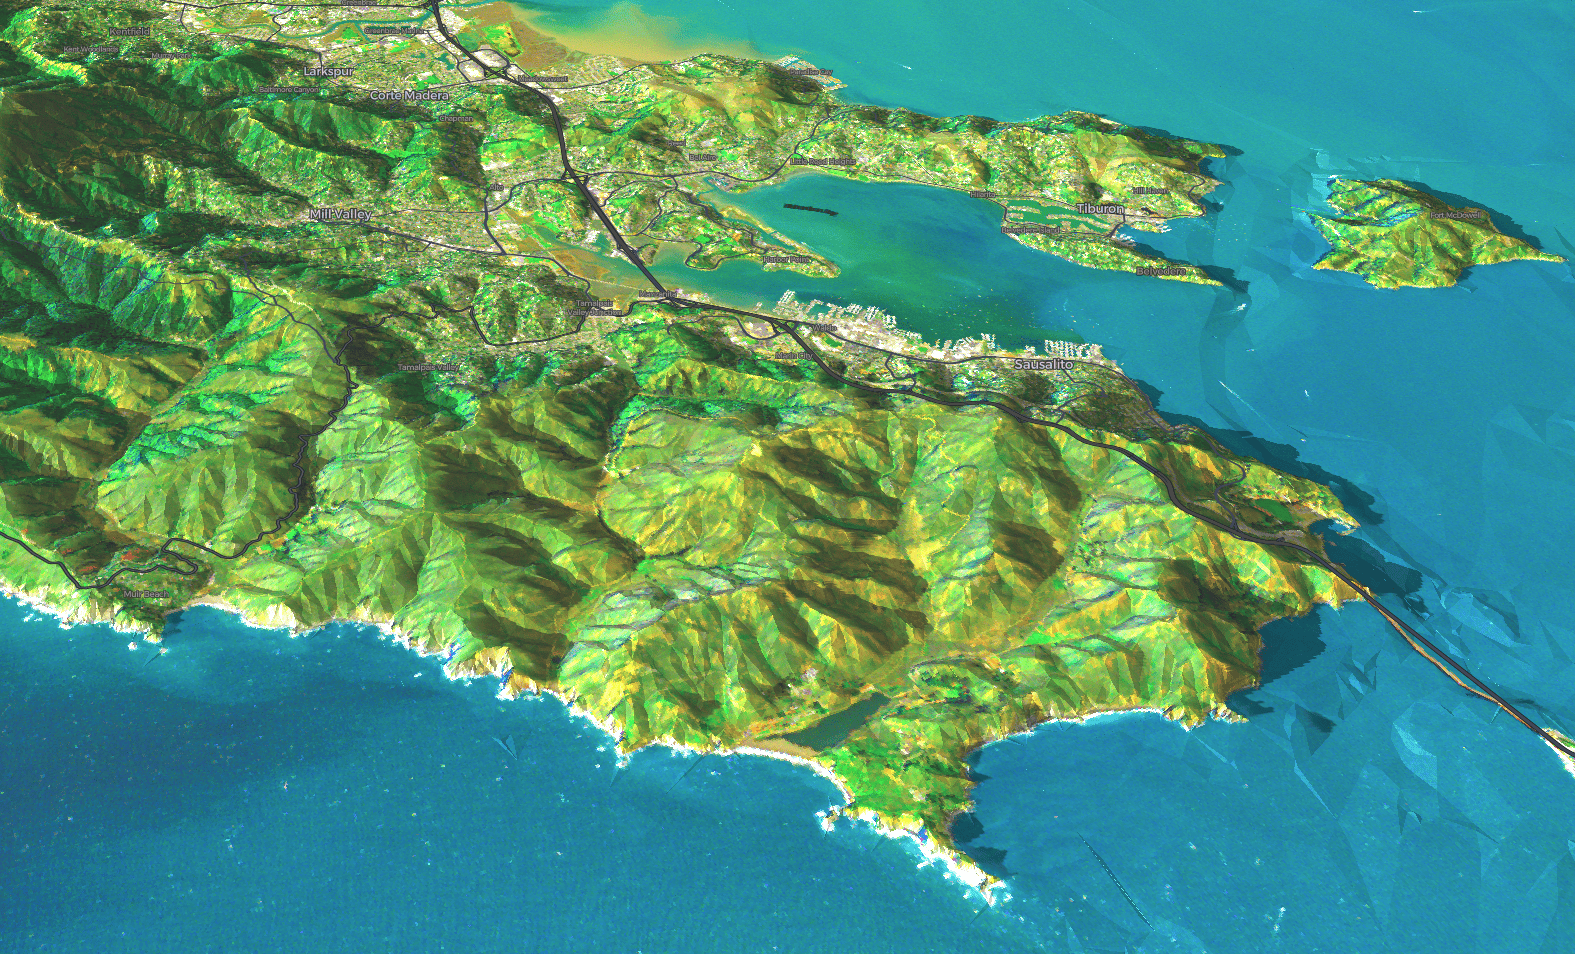
Raster layers are used to show satellite and aerial imagery. They allow you to work interactively directly with massive, image collections stored in .pmtiles (in raster format) or Cloud Optimized GeoTIFF format.
Supported URL templates:
Users can reference remote .pmtiles files in raster format for raster layers by supplying a direct link to the file.
Cloud-Optimized GeoTIFFs (COG) can also be used in raster layers by providing standardized Spatio-Temporal Asset Catalog (STAC) metadata.
The metadata file must be a valid STAC Item or STAC Collection, version 1.0.0 or higher.
Raster data referenced in STAC assets should be Cloud-Optimized GeoTIFFs and need to be publicly accessible via HTTPS.
STAC item and collections must have Electro-Optical and Raster extensions, and at least one asset must have both eo:bands and raster:bands information. common_name must be provided in eo:bands and data_type must be provided in raster:bands.
To use COGs with STAC metadata, you must run your own raster tile server (e.g., TiTiler). Example implementation: kepler-raster-server.
Examples of raster .pmtiles:
Mount Whitney - https://pmtiles.io/usgs-mt-whitney-8-15-webp-512.pmtiles
Swiss historical - https://public-bucket-for-tests.s3.us-east-1.amazonaws.com/historic-swis-18xx.pmtiles
Examples of supported STAC Items:
Bangladesh rivers — https://4sq-studio-public.s3.us-west-2.amazonaws.com/sdk/examples/sample-data/raster/planet-skysat-opendata.json
Antarctica ice — https://4sq-studio-public.s3.us-west-2.amazonaws.com/sdk/examples/sample-data/raster/sentinel-2-l2a.json
Kiribati island — https://4sq-studio-public.s3.us-west-2.amazonaws.com/sdk/examples/sample-data/raster/stac-example.json
Examples of supported STAC Collections:
sentinel-2-l1c — https://earth-search.aws.element84.com/v1/collections/sentinel-2-l1c
modis-09A1-061 — https://planetarycomputer.microsoft.com/api/stac/v1/collections/modis-09A1-061
landsat-c2-l1 — https://planetarycomputer.microsoft.com/api/stac/v1/collections/landsat-c2-l1
For step-by-step instructions, see Raster Tile Layer — How to add.
WMS Layer (experimental)
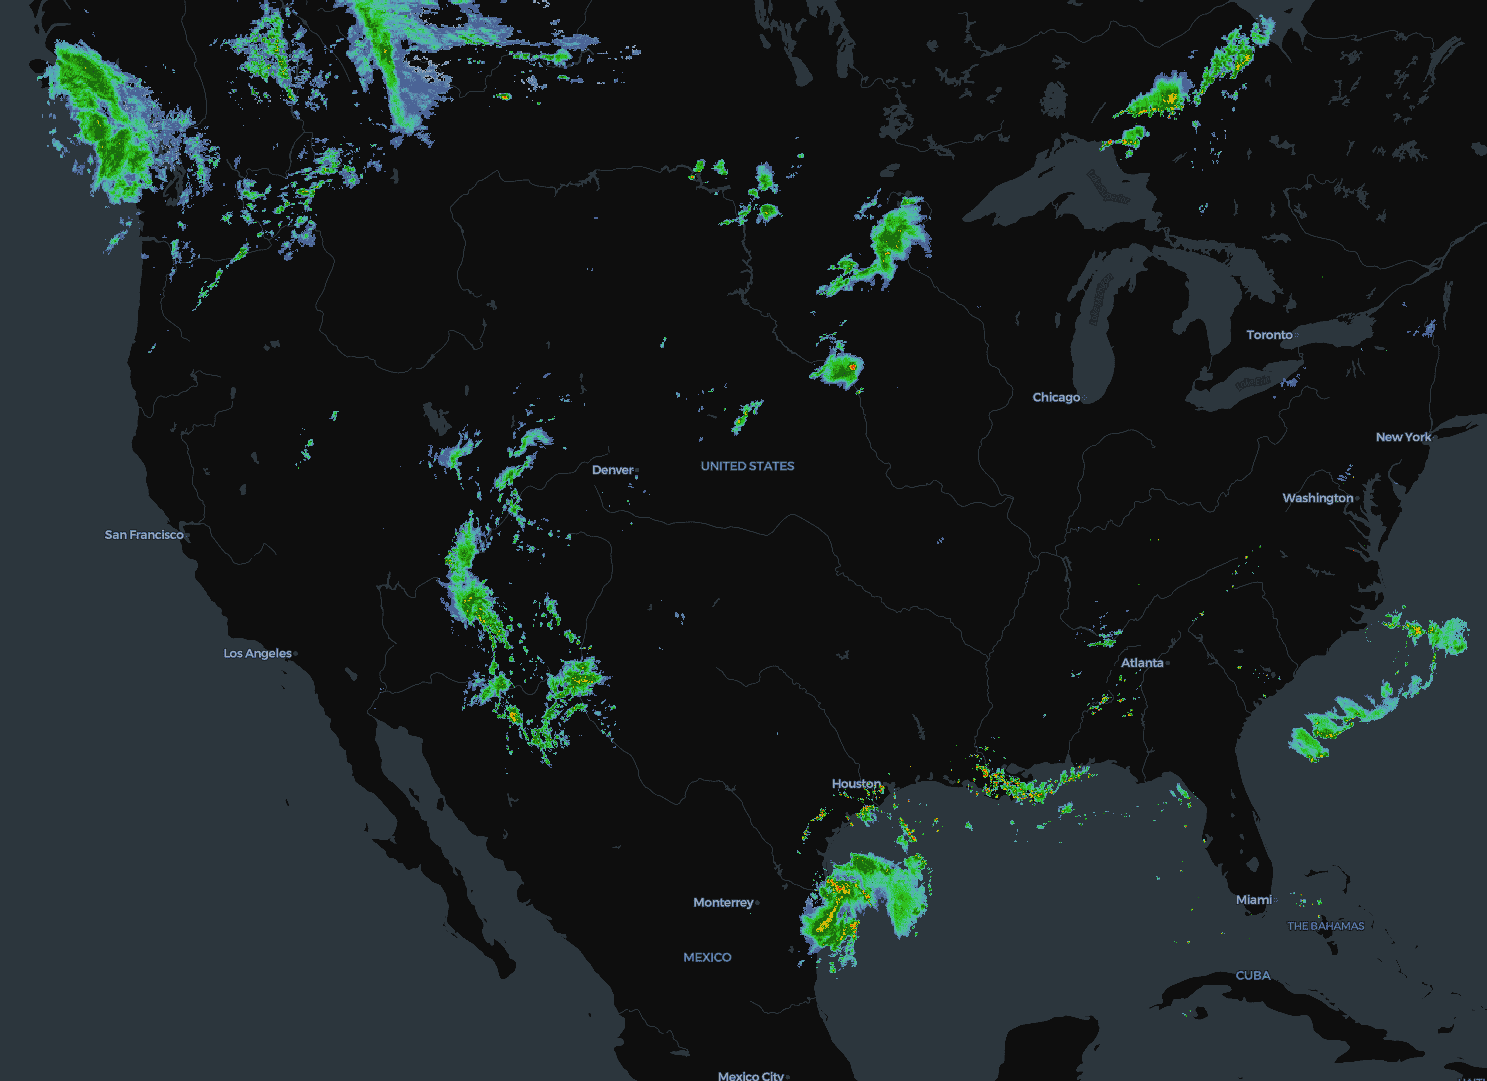
Web Map Service (WMS) layers render raster tiles from OGC WMS servers.
This feature is experimental and disabled by default. To try it, enable
enableWMSLayer: truein the application configuration.When enabled, add a WMS service via the Tilesets modal by providing the service URL and selecting a named layer. Feature info on click is supported for queryable layers.
Examples of supported WMS Tiles:
https://ows.terrestris.de/osm/service
https://opengeo.ncep.noaa.gov/geoserver/conus/conus_cref_qcd/ows
https://gibs.earthdata.nasa.gov/wms/epsg4326/best/wms.cgi
https://geo.stadt-muenster.de/mapserv/starkregen_serv
For step-by-step instructions, see WMS Layer — How to add.
Last updated
Was this helpful?